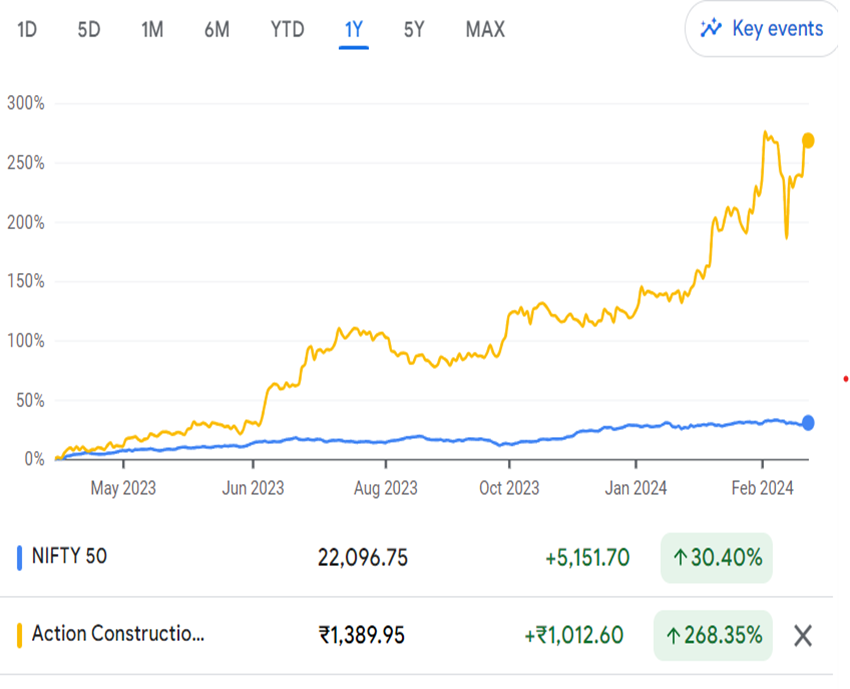
Action Construction Equipment Limited (ACE) Market Price: ₹1393 Recommendation: BUY Target: ₹1794 Time Horizon: 1 Year
Q3FY2024 REVIEW
Action Construction Equipment Limited reported net revenue of ₹776.08 crores for the quarter ended December 31, 2023, compared to ₹564.01 crores for December 31, 2022. Profit After Tax was ₹88.24 crores for the quarter ended December 31, 2023, against the profit of ₹46.70 crores during the corresponding quarter of the previous year, respectively.
OVERVIEW
On February 7, 2024, the company entered into agreements for the purchase of approximately 82.00 acres of land near its existing manufacturing facilities to facilitate further capacity and business expansion.
STOCK DATA
52 Week H/L
1489/368
Market Cap (crores)
16,590
Face Value (₹)
2.00
Book Value
222.96
EPS TTM
77.27
NSE Code
ACE
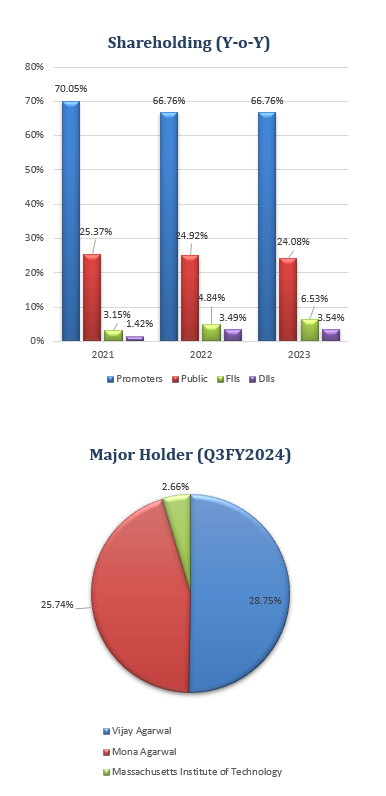
SHAREHOLDING PATTERN (%)
Jun-23
Sep-23
Dec-23
Promoter
66.76
66.76
66.76
Public
23.28
21.48
21.77
DIIs
3.45
2.79
2.61
FIIs
6.51
8.96
8.81
BENCHMARK COMPARISON
Beta: 1.17
Alpha: 237.95
Risk Reward Ratio: 1.50
Margin of Safety: 22%
Action Construction Equipment Limited (ACE) Business
Established in 1995 by Mr. Vijay Agarwal, a seasoned technocrat with over five decades of industry experience, Action Construction Equipment Limited (ACE) is led by a team of proficient professionals.
ACE stands as a well-established and respected brand, boasting a substantial presence across various sectors including Construction, Infrastructure, Manufacturing, Logistics, and Agriculture.
Renowned as the world’s largest manufacturer of Pick & Carry cranes, ACE holds an impressive 63% market share in the Mobile cranes segment nationally, along with a dominant majority share of over 60% in the Tower Cranes segment.
Moreover, ACE offers an extensive range of equipment including Crawler Cranes, Truck Mounted Cranes, Lorry Loaders, Backhoe Loaders/Loaders, Vibratory Rollers, Motor Graders, Forklifts, Tractors & Harvesters, among others.
With a wide-reaching Sales and Service network comprising over 100+ locations backed by 13 regional offices in India, ACE also extends its reach to international markets, exporting to more than 37 countries spanning the Middle East, Africa, Asia, and Latin America.
The company operates from four manufacturing facilities, with its primary plant situated in Palwal, Haryana, and two fabrication units and an R&D unit located in Faridabad. In terms of land ownership, the company possesses approximately 90 acres of industrial land, of which only around 45% is currently utilized.
The manufacturing capacity of the company is as follows:
Cranes: 9,000 units per annum Agriculture equipment: 9,000 units per annum Material handling equipment: 1,800 units per annumConstruction equipment: 1,500 units per annum
The company has introduced several new products to its lineup:
The launch of India’s First Fully Electric Mobile Crane.
Introduction of India’s Largest Mobile Crane – a robust 180 Tons Crawler Crane.
Addition of Aerial Work Platforms and Telehandlers to its product portfolio.
Unveiling of the 35 Tons 4X4 Next-Gen Crane, further enhancing its range of offerings.
India’s construction equipment industry experienced a notable surge in sales during the third quarter of the current fiscal year, marking a 30 % increase to 36,055 units.
This substantial growth compares to the 27,817 units sold during the same period in the previous fiscal year, as reported by the Indian Construction Equipment Manufacturers Association (ICEMA).
Of the total sales recorded in Q3 FY24, 33,135 units were sold within the domestic market, while 2,920 units were exported.
The report further highlights specific increases in various equipment categories:
Material handling equipment sales rose by 46% to 4,482 units.
Concrete equipment sales witnessed a significant growth of 43%, reaching 3,840 units.
Sales of road construction equipment increased by 38 percent to 1,958 units.
Material processing equipment sales also saw a notable rise of 18 percent, totaling 688 units.
In FY23, India’s construction equipment industry achieved remarkable growth, posting a 26% year-on-year increase as sales surpassed the one lakh unit milestone.
This growth was primarily fueled by heightened demand from infrastructure construction and railway projects.
The Indian Construction Equipment Market, valued at USD 7.9 billion in 2023, is projected to further expand and reach a value of USD 12.4 billion by 2029. This growth trajectory reflects an estimated compound annual growth rate (CAGR) of 8.9 percent over the forecast period.
The Indian Construction Equipment market is leveraging the rapid expansion of the infrastructure and construction sectors within the country.
This growth is being propelled by several factors, including increasing public and private capital expenditure, reforms in foreign direct investment (FDI) in the construction sector, and the execution of high-value infrastructure and real estate projects.
These developments have collectively contributed to a significant surge in the overall demand for construction equipment in India.
Action Construction Equipment Limited (ACE) Financial Overview
Action Construction Equipment Limited (ACE) QUARTERLY SUMMARY
Quarterly (₹ in lakhs)
Dec-23
Sep-23
Jun-23
Mar-22
Dec-22
Revenue from Operations
75,311
67,324
65,161
61,384
55,633
Other income
2,297
1,697
1,624
312
768
Total Income
77,608
69,021
66,785
61,696
56,401
Total Expenditure
65,626
58,949
57,517
54,554
49,885
EBIT
11,982
10,072
9,268
7,142
6,516
Finance cost
552
381
314
338
313
PBT before Share of Net Profit of Associate
11,430
9,691
8,954
6,804
6,203
Share of Net Profit of Associate
–
–
–
–
–
PBT before Exceptional Item
11,430
9,691
8,954
6,804
6,203
Exceptional Item
–
–
–
–
–
PBT
11,430
9,691
8,954
6,804
6,203
Tax Expenses
2,606
2,297
2,197
2,089
1,533
PAT
8,824
7,394
6,757
4,715
4,670
PROFIT AND LOSS STATEMENT (₹ in lakhs)
Mar-21
Mar-22
Mar-23
Revenue from Operations
1,22,715.39
1,62,957.50
2,15,967.53
Other Income
1,530.68
1,078.39
4,111.73
Total Income
1,24,246.07
1,64,035.89
2,20,079.26
Cost of Goods Sold
85,601.04
1,17,111.32
1,53,554.88
Employee Benefits Expense
7,216.59
8,480.80
9,975.53
Other Expenses
17,999.54
21,849.08
28,157.68
EBITDA
13,428.90
16,222.74
26,203.43
Depreciation and Amortisation Expense
1,394.48
1,541.26
1,800.00
EBIT
12,034.42
14,681.48
24,403.43
Finance Costs
1,223.28
951.76
1,028.80
EBT before Share of Profit/(Loss) of Joint Venture and Associates
10,811.14
13,729.72
23,374.63
Share of Profit/(Loss) of Joint Venture and Associates
–
–
–
EBT before Exceptional Items
10,811.14
13,729.72
23,374.63
Exceptional Items
–
–
–
EBT
10,811.14
13,729.72
23,374.63
Tax Expense
2,831.91
3,229.93
6,076.32
PAT Non-Controlling Interests
7,979.23
10,499.79
17,298.31
Non-Controlling Interests
3.85
2.39
-138.37
PAT
7,983.08
10,502.18
17,159.94
EPS
Basic
7.03
9.02
14.41
Diluted
7.03
9.02
14.41
Number of Shares
Basic
1,134.83
1,164.08
1,190.83
Diluted
1,134.83
1,164.08
1,190.83
Balance Sheet (₹ lakhs)
Mar-21
Mar-22
Mar-23
ASSETS:
Non-Current Assets:
Property, Plant and Equipment
41,611.94
43,552.32
47,227.55
Capital Work in Progress
1,254.87
2,429.27
2,441.43
Investment Property
1,198.86
1,175.29
1,151.72
Right-of-Use Assets
–
174.49
116.14
Intangible Assets
122.45
266.21
249.31
Financial Assets:
–
–
–
Investments
638.93
8,020.39
13,674.35
Other Financial Assets
660.13
1,626.28
3,482.20
Other Tax Assets
972.66
36.60
67.18
Other Non-Current Assets
14.19
676.25
415.66
Total Non-Current Assets
46,474.03
57,957.10
68,825.54
Current Assets:
Inventories
26,604.76
33,337.29
41,854.41
Financial Assets:
Investments
2,504.74
9,903.91
21,191.42
Trade Receivables
22,467.76
18,872.42
16,933.57
Cash and Cash Equivalents
3,288.70
572.39
2,148.15
Other Bank Balances
362.67
858.11
2,747.48
Loans
–
78.00
65.57
Other Financial Assets
230.20
198.69
777.61
Other Current Assets
3,572.74
6,458.66
5,430.25
Current Tax Assets
22.93
–
–
Total Current Assets
59,054.50
70,279.47
91,148.46
Total Assets
1,05,528.53
1,28,236.57
1,59,974.00
EQUITY AND LIABILITIES:
Equity:
Equity Share Capital
2,269.66
2,381.66
2,381.66
Other Equity
50,057.64
73,027.20
89,474.23
Equity Attributable to the Owners
52,327.30
75,408.86
91,855.89
Non-Controlling Interest
26.36
23.97
162.34
Total Equity
52,353.66
75,432.83
92,018.23
Liabilities:
Non-Current Liabilities:
Financial Liabilities
Borrowings
2,013.40
–
–
Lease Liabilities
13.46
124.50
68.72
Provisions
185.35
228.10
265.62
Deferred Tax Liabilities
1,605.94
1,350.41
1,334.26
Total Non-Current Liabilities
3,818.15
1,703.01
1,668.60
Current Liabilities:
Financial Liabilities:
Borrowings
3,408.66
2,924.47
620.32
Lease Liabilities
22.18
53.25
55.78
Trade Payables:
Total outstanding dues of micro enterprises and small enterprises
3,851.68
869.74
12,035.64
Other Creditors
29,198.41
40,401.61
38,056.78
Other Financial Liabilities
8,752.55
2,116.16
2,309.57
Other Current Liabilities
3,797.46
4,184.97
12,958.34
Provisions
141.84
178.96
250.74
Current Tax Liabilities
183.94
371.57
–
Total Current Liabilities
49,356.72
51,100.73
66,287.17
Total Equity & Liabilities
1,05,528.53
1,28,236.57
1,59,974.00
Cash Flow Statement (₹ lakhs)
Mar-21
Mar-22
Mar-23
Net Profit Before Tax
10,811.14
13,729.72
23,374.63
Net Cash from Operating Activities
8,606.27
10,351.57
27,427.78
Net Cash Used for Investing Activities
-1,622.56
-20,148.29
-21,751.33
Net Cash From (Used For) Financing Activities
-4,034.01
7,080.41
-4,100.69
Net Increase in Cash and Cash Equivalents
2,949.70
-2,716.31
1,575.76
Cash And Cash Equivalents at The Beginning of The Year
339.00
3,288.70
572.39
Cash And Cash Equivalents at The End of the Year
3,288.70
572.39
2,148.15
Ratio Analysis
Mar-21
Mar-22
Mar-23
Profitability Ratio
EBITDA Margin
10.94%
9.96%
12.13%
EBIT Margin
9.81%
9.01%
11.30%
Pre-Tax Margin
8.81%
8.43%
10.82%
Net Profit Margin
6.51%
6.44%
7.95%
Return on Investment
Return on Asset – ROA
8%
9%
12%
Return on Capital Employed – ROCE
23%
22%
29%
Return on Equity – ROE
17%
16%
20%
Liquidity Ratio (x)
Current ratio
1.20
1.38
1.38
Quick Ratio
0.66
0.72
0.74
Solvency Ratio
Debt to Equity
0.04
–
–
Interest Coverage Ratio
9.84
15.43
23.72
Action Construction Equipment Limited (ACE) Technical Analysis
Overview:
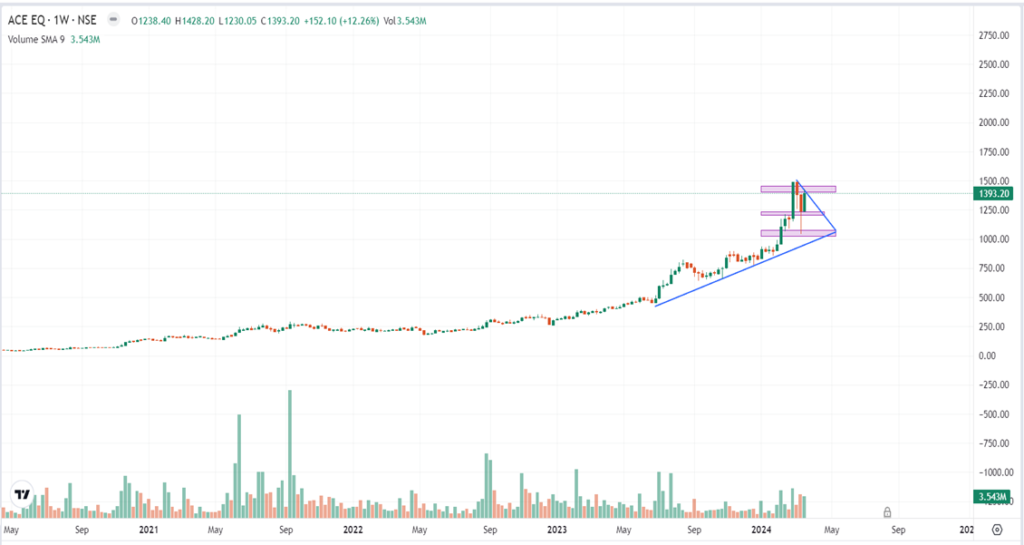
ACE has recently experienced a significant breakout around ₹1025, resulting in a notable return of approximately 56% and reaching an all-time high of ₹1428 on March 2, 2024. Despite a subsequent 16% correction, the stock found support at ₹1246 and rebounded towards its resistance level of ₹1400. Both weekly and monthly trends indicate an upward trajectory, presenting a short-term trading opportunity.
Key Points:
Breakout at ₹1025 with a return of 56%.
Support and resistance levels at ₹1025 and ₹1400 respectively.
Recent correction finding support at ₹1246.
Bullish momentum evident on both weekly and monthly charts.
Strategy:
Consider long positions near or above ₹1400, targeting recent highs around ₹1428.
Place a stop-loss slightly below ₹1246 to manage downside risk.
Monitor price action closely for further opportunities and adjust positions accordingly.
Conclusion:
ACE demonstrates strong bullish momentum and potential for short-term gains. Traders can capitalize on the current upward trend, utilizing well-defined support and resistance levels for strategic entry and exit points.
Con-Call (Q3FY2024)
The company achieved its highest-ever quarterly revenue in Q3 FY24, reaching ₹ 753 crores. EBITDA surged to ₹ 125.89 crores, with margins expanding by 415 basis points to 16.22%.
Profit Before Tax (PBT) stood at ₹ 114.58 crores, and Profit After Tax (PAT) at ₹ 88.52 crores, with margins expanding by 400 and 340 basis points respectively. Operational revenue grew by 34.34% for 9M FY24 compared to FY23, with growth witnessed across all operating segments.
The Crane segment led with 43% YoY revenue growth. Growth expectations include at least 30% in the Crane segment, 50% in Construction Equipment, and 15-20% in Metal Handling and Agri segments for the current year.
A new manufacturing facility for higher capacity cranes is set to be fully operational by the end of Q4, with plans for additional expansion beyond ₹ 5,000 crores revenue.
Capital expenditure plans amount to around ₹ 100 crores for the current year and ₹ 50-60 crores for the next. The company plans to introduce new products such as electric cranes and aerial work platforms. Positive demand outlook is attributed to robust growth in the Indian economy.
Inorganic growth opportunities, particularly in the defense sector, are being explored, with an order for 1,800 Rough Terrain Forklifts from the Army. Revenue targets aim for ₹ 4,400 crores in FY26 and ₹ 5,500 crores in FY27, with a long-term goal of doubling revenue by FY26 and reaching ₹ 5,500 crores by FY27.
Potential challenges include commodity inflation and geopolitical situations affecting exports. The dividend policy is expected to increase from 10% to 15-20% of net profits.
Overall, the company has demonstrated robust financial performance, and segment-wise growth, and has ambitious expansion and innovation plans for the future.
Recommendation Rationale
Dominant position as the market leader in the crane segment, underpinned by a robust and extensive client base:
ACE asserts its dominance as the market leader in the crane segment, boasting an impressive market share of approximately 60-63% in both pick-and-carry and fixed tower crane products. Continuously driving innovation, ACE consistently introduces new product offerings to maintain a contemporary and competitive product portfolio. Additionally, ACE holds a prominent position among the top three players in India’s forklift segment, alongside Godrej & Boyce Mfg. Co. Ltd. and Kion Group AG.
The company’s extensive clientele includes key players in infrastructure, manufacturing, and government sectors. Notable clients encompass industry leaders such as L&T, Tata, Ashoka Buildcon, Aditya Birla, ACC, Dabur, Novartis, HP, BHEL, Coal India, RITES, Indian Oil, BEML, Adani, Reliance, among others. ACE’s strong presence and trusted partnerships underscore its reliability and standing within the market.
The company boasts a well-diversified product portfolio, encompassing a wide range of offerings across various segments:
ACE possesses a diverse portfolio spanning applications in infrastructure, industrial, and agricultural sectors. Notably, its stronghold lies in the infrastructure segment, where it stands out as one of the few companies offering a comprehensive range of products essential for this sector.
Moreover, ACE has been at the forefront of innovation, consistently introducing new models and variants tailored to specific applications. Examples include the NX series multi-activity cranes, piling rigs, Li-ion electric forklifts, and multi-purpose tractors, showcasing the company’s commitment to meet evolving market demands and staying ahead of the competition.
Strong financial risk profile:
The company exhibits robust credit indicators, bolstered by minimal capital expenditure in recent years and consistent enhancements in scale and profitability. Notably, in FY2023, the company witnessed a significant enhancement in its interest coverage indicator, soaring to 23.72x from 15.43x in FY2022. Furthermore, the company has maintained a net-debt-free status, further solidifying its financial stability and resilience.
Valuation
Action Construction Equipment Limited has shown revenue growth of 23.15% CAGR for FY2020-2023.
The company has shown Net profit growth of 48.21% of CAGR for FY2020-2023
The company’s ROCE is 29%, and ROE is 20%.
To project income for the fiscal years 2024–2028, we used data from the previous four years (2020–2023).
Estimated Income Statement (₹ in lakhs)
Mar-24
Mar-25
Mar-26
Mar-27
Mar-28
2024-E
2025-E
2026-E
2027-E
2028-E
Revenue
2,71,931.82
3,36,078.35
4,15,441.46
5,13,639.34
6,35,151.39
Operating Expenses
1,89,613.28
2,34,777.34
2,90,699.04
3,59,940.76
4,45,675.19
Employee Expenses
12,351.61
15,293.64
18,936.44
23,446.91
29,031.74
Other Expenses
35,359.16
43,781.38
54,209.68
67,121.90
83,109.70
EBITDA
34,607.78
42,225.99
51,596.30
63,129.76
77,334.76
Depreciation
1,980.34
2,195.77
2,472.54
2,824.87
3,270.40
EBIT
32,627.43
40,030.23
49,123.76
60,304.89
74,064.36
Financial Cost
1,261.31
1,546.19
1,895.88
2,325.55
2,853.99
EBT before Share of Profit/(Loss) of Joint Venture and Associates
31,366.13
38,484.04
47,227.88
57,979.34
71,210.37
Share of Profit/(Loss) of Joint Venture and Associates
–
–
–
–
–
PBT
28,657.29
35,129.98
43,074.92
52,837.18
64,843.40
Tax expenses
7,449.57
9,132.17
11,197.48
13,735.22
16,856.28
PAT
23,916.56
29,351.87
36,030.40
44,244.12
54,354.10
DISCLAIMER
This report is only for the information of our customers. Recommendations, opinions, or suggestions are given with the understanding that readers acting on this information assume all risks involved. The information provided herein is not to be construed as an offer to buy or sell securities of any kind. ATS and/or its group companies do not as assume any responsibility or liability resulting from the use of such information.