Archean Chemical Industries Limited – Market Price: ₹625 Recommendation: BUY Target: ₹1118 Time Horizon: 1.5 Year
Q3FY2024 REVIEW
Archean Chemical Industries Limited reported net revenue of ₹421.86 crores for the quarter ended December 31, 2023, compared to ₹372.40 crores for December 31, 2022. Profit After Tax was ₹101.53 crores for the quarter ended December 31, 2023, against the profit of ₹98.06 crores during the corresponding quarter of the previous year, respectively.
OVERVIEW
- The Company’s wholly-owned subsidiary, Acume Chemicals Private Limited, successfully commissioned Phase 1 of its production facility for Bromine derivative products at its Gujarat factory, effective March 14, 2024.
STOCK DATA
| 52 Week H/L | 494/837 |
| Market Cap (crores) | 7,716 |
| Face Value (₹) | 2.00 |
| Book Value | 222.96 |
| EPS TTM | 116.29 |
| NSE Code | ACI |
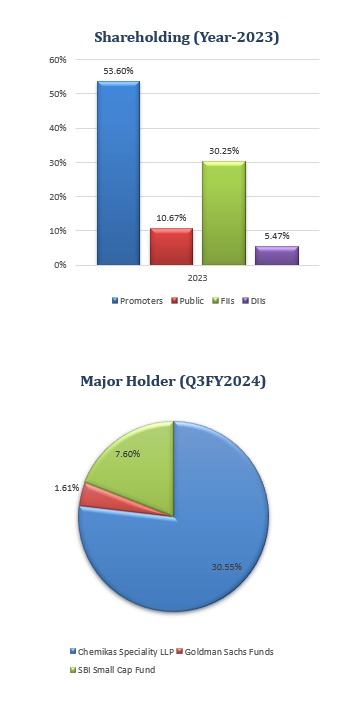
SHAREHOLDING PATTERN (%)
| Jun-23 | Sep-23 | Dec-23 | |
| Promoter | 54.60 | 53.60 | 53.46 |
| Public | 11.55 | 13.08 | 13.71 |
| DIIs | 30.78 | 30.38 | 28.69 |
| FIIs | 4.06 | 2.92 | 4.15 |
BENCHMARK COMPARISON
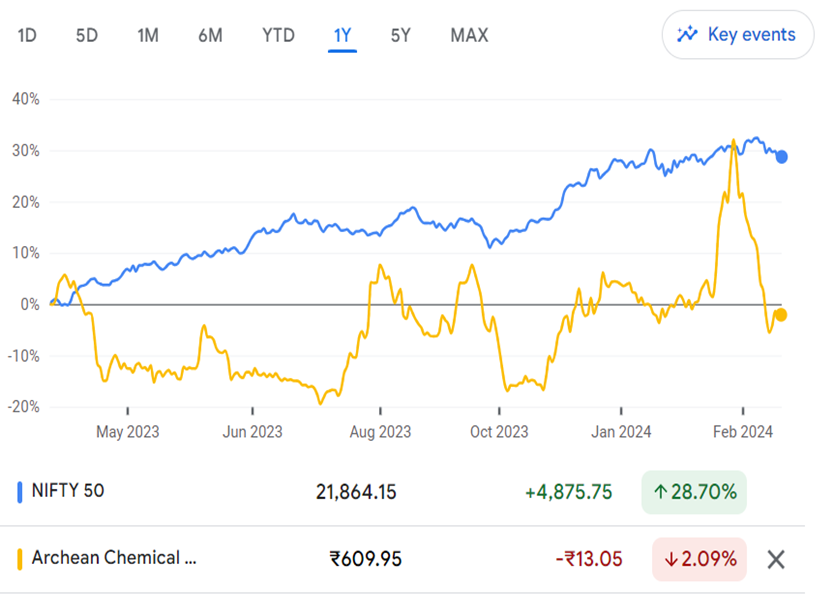
| Beta: 48 | Alpha: -30.7 | Risk Reward Ratio: 2.98 | Margin of Safety: 44% |
Archean Chemical Industries Limited BUSINESS
- ACIL is a prominent manufacturer of speciality chemicals headquartered in India. The Company boasts a significant presence in global markets. Established in 2009, the Company operates a processing facility in the Greater Rann of Kutch district of Gujarat.
- The product categories of Archean Chemical Industries Limited encompass:
- Bromine: Archean dominates the Indian bromine merchant sales market, primarily exporting bromine to China while catering to domestic demand. Given the hazardous nature of bromine transportation, specialized nickel and lead-lined ISO containers are required, and the Company has a fleet of 228 containers (owned and leased). Bromine is a crucial raw material with diverse applications in drugs, agrochemicals, water treatment, fire retardants, added substances, oil and gas, and energy stockpiling batteries.
- Industrial Salt: ACIL emerged as India’s top exporter of industrial salt, with its exports predominantly directed towards customers in Japan and China. Industrial salt is a primary ingredient in chlorine and caustic soda production and finds extensive applications across the chemical, food, and beverage industries. Archean operates one of the world’s largest salt works in one location. Additionally, their industrial salt-washing facility comprises three washeries, each capable of handling 200 tons per hour.
- Sulphate of Potash: It is also called potassium sulphate and is a premium-grade speciality fertilizer suitable for chlorine-sensitive crops. Additionally, it has medical applications, aiding in reducing plasma potassium concentration during hypokalemia. Archean is the sole manufacturer of sulphate of potash derived from natural sea brine in India. The Company exports 70% of its production, catering to global demand.
- Archean operates an integrated production facility for bromine, industrial salt, and sulphate of potash in Hajipir, Gujarat. This facility enjoys strategic proximity to the captive Jakhau Jetty and Mundra Port, facilitating efficient logistics and transportation.
- The Company raised ₹1463 crores through its Initial Public Offering (IPO) and was listed on November 25, 2022. Out of this, ₹657 crores came from an Offer for Sale, while ₹805 crores were garnered through a Fresh Issue. The funds from the Fresh Issue were allocated for the following purposes:
- Redemption of Non-Convertible Debentures (NCDs) issued by the Company.
- General corporate purposes.
- The product categories of Archean Chemical Industries Limited encompass:
SWOT ANALYSIS
- STRENGTH
- Market Leadership.
- Integrated Production Facility.
- Strategic Location.
- Unique Product Offerings.
- WEAKNESS
- Dependency on Exports.
- Transportation Challenges
- OPPORTUNITIES
- Diversification.
- Technological Advancements.
- Emerging Markets.
- THREAT
- Regulatory Risks.
- Economic Uncertainty.
CHEMICAL SECTOR ANALYSIS
- Bromine Industry Overview:
- Bromine, a halogen chemical element, is primarily obtained from soluble salts in seawater, salt lakes, inland seas, and brine wells. Seawater is the chief commercial source. The process involves extracting bromine from brine after removing most sodium chloride and potash. Regions with higher bromine concentrations are typically found in inland seas and brine wells.
- Significant producers of bromine and brominated compounds include Israel, Jordan, the United States, and India, particularly in the Rann of Kutch region. In 2021, the global market volume of bromine reached 933,410 metric tons. Projections suggest that the market volume of this halogen is expected to grow to approximately 1.18 million metric tons worldwide by 2029.
- Industrial Salt Industry Overview:
- Industrial salt is the primary material used to produce chlorine and caustic soda, collectively called chloralkali, and it sees widespread application across the chemical, food, and beverage sectors. Chlorine is utilized in various end-uses such as vinyl, phosgene, chloromethanes, chlorinated C3, water treatment, combination of HCI, bleach, and other organic and inorganic chemical materials. Similarly, caustic soda finds its end-involves in alumina, paper and mash, cleanser and cleansers, materials, water treatment, dye, and other natural and inorganic synthetic materials.
- Frost & Sullivan reports that the global demand for industrial salt stood at 173 million MT in CY 2017, decreased to 171 million MT in CY 2018, and rose again to 173 million MT in CY 2019. However, it declined to 153 million MT in CY 2020. Nevertheless, it is anticipated to develop at a build yearly development rate (CAGR) of 2.6% from CY 2020 to CY 2025.
- Sulphate of Potash Industry Overview:
- Sulphate potash, a high-end speciality fertilizer tailored for chlorine-sensitive crops, is one of the most sought-after types of low-chloride potash. This preference is mainly attributed to its substantial 50-52% K2O content, which provides approximately 50% of the required plant nutrients. Frost & Sullivan reports that global demand for sulphate of potash reached 6.9 million MT in CY 2021 and is projected to encounter a build yearly development rate (CAGR) of 6.0% between CY 2021 and CY 2025.
Archean Chemical Industries Limited Financial Overview
QUARTERLY SUMMARY
| Quarterly (INR in lakhs) | Dec-23 | Sep-23 | Jun-23 | Mar-22 | Dec-22 |
| Revenue from Operations | 41,262.61 | 29,046.65 | 34,309.38 | 38,237.48 | 36,492.28 |
| Other income | 923.93 | 1,119.20 | 1,092.95 | 833.14 | 747.37 |
| Total Income | 42,186.54 | 30,165.85 | 35,402.33 | 39,070.62 | 37,239.65 |
| Total Expenditure | 28,484.46 | 21,251.00 | 22,586.62 | 20,527.12 | 22,179.80 |
| EBIT | 13,702.08 | 8,914.85 | 12,815.71 | 18,543.50 | 15,059.85 |
| Finance cost | 189.50 | 185.27 | 301.25 | 341.72 | 1,941.91 |
| PBT before Share of Net Profit of Associate | 13,512.58 | 8,729.58 | 12,514.46 | 18,201.78 | 13,117.94 |
| Share of Net Profit of Associate | – | – | – | – | – |
| PBT before Exceptional Item | 13,512.58 | 8,729.58 | 12,514.46 | 18,201.78 | 13,117.94 |
| Exceptional Item | – | – | – | – | – |
| PBT | 13,512.58 | 8,729.58 | 12,514.46 | 18,201.78 | 13,117.94 |
| Tax Expenses | 3,359.79 | 2,129.32 | 3,118.84 | 4,550.83 | 3,311.87 |
| PAT | 10,152.79 | 6,600.26 | 9,395.62 | 13,650.95 | 9,806.07 |
PROFIT AND LOSS STATEMENT (₹ in lakhs)
| Mar-21 | Mar-22 | Mar-23 | |
| Revenue from Operations | 74,076.43 | 1,13,043.71 | 1,44,106.59 |
| Other Income | 1,402.56 | 1,239.01 | 4,327.13 |
| Total Income | 75,478.99 | 1,14,282.72 | 1,48,433.72 |
| Cost of Goods Sold | 889.39 | 3,932.09 | 273.04 |
| Employee Benefits Expense | 3,532.08 | 3,784.19 | 7,204.70 |
| Other Expenses | 43,432.33 | 58,612.09 | 73,229.14 |
| EBITDA | 27,625.19 | 47,954.35 | 67,726.84 |
| Depreciation and Amortisation Expense | 5,538.35 | 6,686.19 | 6,863.34 |
| EBIT | 22,086.84 | 41,268.16 | 60,863.50 |
| Finance Costs | 13,039.25 | 16,166.88 | 9,695.90 |
| EBT before Share of Profit/(Loss) of Joint Venture and Associates | 9,047.59 | 25,101.28 | 51,167.60 |
| Share of Profit/(Loss) of Joint Venture and Associates | – | – | – |
| EBT before Exceptional Items | 9,047.59 | 25,101.28 | 51,167.60 |
| Exceptional Items | – | – | – |
| EBT | 9,047.59 | 25,101.28 | 51,167.60 |
| Tax Expense | 2,388.93 | 6,280.91 | 12,911.68 |
| PAT Non-Controlling Interests | 6,658.66 | 18,820.37 | 38,255.92 |
| Non-Controlling Interests | – | – | – |
| PAT | 6,658.66 | 18,820.37 | 38,255.92 |
| EPS | |||
| Basic | 34.56 | 18.22 | 34.66 |
| Diluted | 32.24 | 18.22 | 34.59 |
| Number of Shares | |||
| Basic | 192.67 | 1,032.74 | 1,103.73 |
| Diluted | 206.55 | 1,032.74 | 1,106.09 |
Balance Sheet (₹ lakhs)
| Mar-21 | Mar-22 | Mar-23 | |
| ASSETS: | |||
| Non-Current Assets: | |||
| Property, Plant and Equipment | 1,00,718.55 | 1,04,549.48 | 1,06,488.65 |
| Capital Work in Progress | 1,893.17 | 1,719.64 | 3,617.91 |
| Right-of-Use Assets | 3,498.10 | 4,055.44 | 4,502.35 |
| Intangible Assets | 13.33 | 14.48 | 17.30 |
| Intangible Assets Under Development | – | 3.50 | – |
| Financial Assets: | – | – | – |
| Investments | 8.72 | 9.01 | – |
| Loans | – | – | – |
| Other Financial Assets | 162.44 | 179.71 | 2,193.62 |
| Deferred Tax Assets | 5,329.23 | – | 30.81 |
| Other Non-Current Assets | 1,720.24 | 2,735.10 | 989.98 |
| Total Non-Current Assets | 1,13,343.78 | 1,13,266.36 | 1,17,840.62 |
| Current Assets: | |||
| Inventories | 11,062.56 | 12,078.75 | 16,776.37 |
| Financial Assets: | |||
| Investments | 4,116.89 | 1,111.95 | 21,007.73 |
| Trade Receivables | 6,807.30 | 15,297.34 | 11,774.33 |
| Cash and Cash Equivalents | 3,150.41 | 1,219.84 | 597.26 |
| Other Bank Balances | 30.93 | 4,649.90 | 2,669.99 |
| Loans | 46.15 | 46.80 | 42.84 |
| Other Financial Assets | 1,419.64 | 1,459.56 | 1,631.63 |
| Other Current Assets | 3,425.30 | 4,000.77 | 3,202.57 |
| Total Current Assets | 30,059.18 | 39,864.91 | 57,702.72 |
| Total Assets | 1,43,402.96 | 1,53,131.27 | 1,75,543.34 |
| EQUITY AND LIABILITIES: | |||
| Equity: | |||
| Equity Share Capital | 1,926.67 | 1,926.67 | 2,461.06 |
| Other Equity | 5,471.10 | 24,301.89 | 1,40,640.92 |
| Equity Attributable to the Owners | 7,397.77 | 26,228.56 | 1,43,101.98 |
| Non-Controlling Interest | – | – | – |
| Total Equity | 7,397.77 | 26,228.56 | 1,43,101.98 |
| Liabilities: | |||
| Non-Current Liabilities: | |||
| Financial Liabilities | |||
| Borrowings | 84,641.15 | 84,283.29 | 78.80 |
| Lease Liabilities | 4,017.82 | 4,548.95 | 3,571.20 |
| Other Financial Liabilities | 12,038.81 | 7,698.94 | – |
| Other Non-Current Liabilities | 17,037.78 | 11,822.95 | – |
| Provisions | 41.19 | 33.83 | 4.79 |
| Deferred Tax Liabilities | – | 956.00 | 11,545.46 |
| Total Non-Current Liabilities | 1,17,776.75 | 1,09,343.96 | 15,200.25 |
| Current Liabilities: | |||
| Financial Liabilities: | |||
| Borrowings | 931.21 | 205.10 | 2,070.41 |
| Lease Liabilities | 490.64 | 686.05 | 1,218.12 |
| Trade Payables: | |||
| Total outstanding dues of micro-enterprises and small enterprises | 228.44 | 242.25 | 1,796.83 |
| Other Creditors | 10,949.90 | 10,987.07 | 7,758.67 |
| Other Financial Liabilities | 1,680.11 | 489.53 | 2,144.93 |
| Derivatives Liabilities | 3,861.79 | 3.91 | – |
| Other Current Liabilities | 86.35 | 4,862.38 | 1,943.08 |
| Current Tax Liabilities | – | – | 283.37 |
| Provisions | – | 82.46 | 25.70 |
| Total Current Liabilities | 18,228.44 | 17,558.75 | 17,241.11 |
| Total Equity & Liabilities | 1,43,402.96 | 1,53,131.27 | 1,75,543.34 |
Cash Flow Statement (₹ lakhs)
| Mar-21 | Mar-22 | Mar-23 | |
| Net Profit Before Tax | 9,047.59 | 25,101.28 | 51,167.60 |
| Net Cash from Operating Activities | 11,909.57 | 31,451.92 | 49,608.88 |
| Net Cash Used for Investing Activities | -175.24 | -11,010.85 | -29,034.55 |
| Net Cash From (Used For) Financing Activities | -11,031.86 | -22,371.64 | -21,196.91 |
| Net Increase in Cash and Cash Equivalents | 702.47 | -1,930.57 | -622.58 |
| Cash And Cash Equivalents at The Beginning of The Year | 2,447.85 | 3,150.32 | 1,219.75 |
| Cash And Cash Equivalents at The End of the Year | 3,150.32 | 1,219.75 | 597.17 |
Ratio Analysis
| Mar-21 | Mar-22 | Mar-23 | |
| Profitability Ratio | |||
| EBITDA Margin | 37.29% | 42.42% | 47.00% |
| EBIT Margin | 29.82% | 36.51% | 42.24% |
| Pre-Tax Margin | 12.21% | 22.20% | 35.51% |
| Net Profit Margin | 8.99% | 16.65% | 26.55% |
| Return on Investment | |||
| Return on Asset – ROA | 5% | 13% | 23% |
| Return on Capital Employed – ROCE | 18% | 32% | 41% |
| Return on Equity – ROE | 163% | 112% | 45% |
| Liquidity Ratio (x) | |||
| Current ratio | 1.65 | 2.27 | 3.35 |
| Quick Ratio | 1.04 | 1.58 | 2.37 |
| Solvency Ratio | |||
| Debt to Equity | 11.44 | 3.21 | 0.00 |
| Interest Coverage Ratio | 1.69 | 2.55 | 6.28 |
Technical Analysis
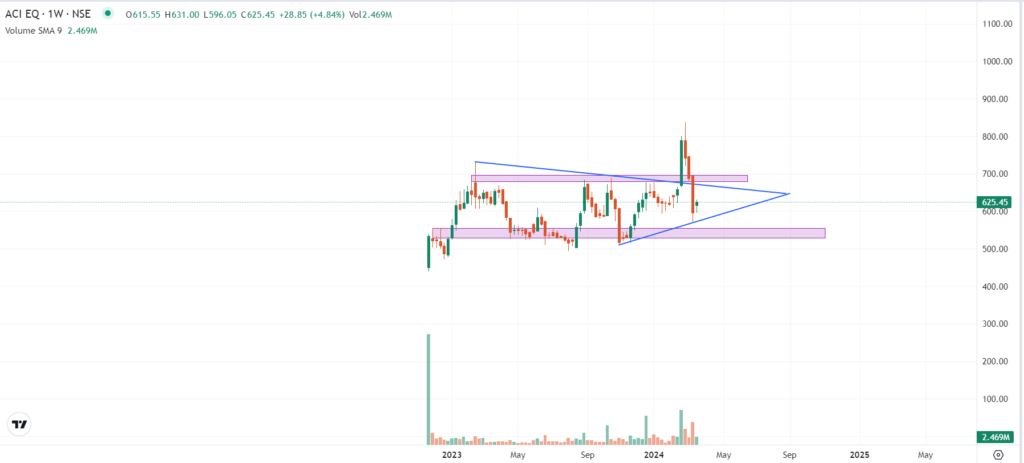
- Overview:
- Archean Chemical Industries Limited (ACIL) has undergone a correction of approximately 30% from its peak of ₹837 but recently experienced a breakout following consolidation on February 19, 2024. The stock has found support at ₹550 and shows signs of rebounding.
- Support and Resistance:
- Support at ₹550, Resistance at ₹700.
- Price Action:
- The breakout from consolidation and the rebound from support suggest potential bullish momentum.
- Trendline Analysis:
- The presence of an upward-trending trend line supports the bullish outlook.
- Conclusion:
- The recent correction, followed by a rebound, indicates a potential bullish trend for ACIL.
Con-Call (Q3FY2024)
- Recent challenges encountered by the chemical sector include the impact of China’s economy on end-user industries. Archean Chemicals maintains steady performance despite external hurdles.
- Notably, Q3 FY24 witnessed robust growth with a 13% revenue increase, although businesses with agrochemical players faced difficulties.
- Specific end-user industries, like bromine, experienced stabilization, while global geopolitical tensions affected customer inquiries.
- Bromine prices stabilized around $2.75 to $3, with industrial salt volume remaining consistent at over 1 million tons. The sulphate of potash business is expanding with new clients and trials. Financially, there’s a substantial EBITDA margin of around 37%, and a second interim dividend for FY24 was announced.
- Expectations for FY25 include revenue ranging between INR 200-300 crores from bromine derivatives, with margins anticipated to be 35-40% for the combined business.
- The bidding price for the ORN Hydrocarbon acquisition is INR 76.55 crores. Progress is being made on the bromine derivatives facility in Gujarat, while the acquisition of Oren Hydrocarbons focuses on oil drilling products.
- Revenue growth is anticipated in FY26 from the flame-retardant business, focusing on the export market for industrial salt due to product portfolio preferences. A sustainable salt transit rate of 1.3 million metric tons is expected.
Recommendation Rationale
- Established Market Presence and Clientele:
- ACIL is a prominent bromine market player, boasting India’s largest capacity. The Company is dominant in this sector and has a remarkable market share. The Company makes approximately 60-70% of bromine exports. Additionally, ACIL emerges as a critical producer of industrial salt within India, boasting a capacity exceeding 3 million MTPA. All industrial salt produced is exclusively exported, primarily to Japan, South Korea, and China. Sojitz Corporation stands as the largest customer of industrial salt. Sojitz subsequently distributes the salt across South Korea, Japan, and China. Furthermore,
ACIL is the sole player in Asia that produces sulfate of potassium (SOP) from natural resources. SOP is a crucial component in fertilizers for chlorine-sensitive crops. With a robust clientele totalling 66, including 29 global clients, ACIL’s major customers comprise Sojitz Corporation Japan, UniBrom, and Tianyi Group, among others.
- Brownfield Expansion Plans:
- ACIL has made significant strides in enhancing its production capacities and diversifying its product offerings in Hajipir, Gujarat; the CCompanyaugmented its Bromine capacity by an impressive 18,000 MT per annum by adding a feed enrichment section. Furthermore, in FY23, an additional capacity of 14,500 MT per annum was incorporated, and it was dedicated to producing Bromine Derivatives for an upcoming greenfield project.
- Additionally, plans are underway to expand manufacturing capacities for Industrial Salt production by introducing an extra washery with a limit of 250 tons each hour. Moreover, ACIL intends to establish a new facility at Jhagadia, GIDC, via its subsidiary, Acume Chemicals Private Limited. This facility will focus on manufacturing Bromine Performance Derivatives, primarily Brominated flame retardants, Clear Brine Fluids, and Bromine Catalysts, showcasing ACIL’s commitment to innovation and expansion within the chemical industry.
- Financial solid risk profile:
- As of March 31, 2023, Archean Chemicals Limited (ACIL) boasts a healthy net worth of ₹1430 crores. Significant capex additions in recent years have ensured sufficient capacity for critical products. Pre-IPO, elevated debt levels, primarily from high-cost NCDs, coupled with fluctuating profitability, led to aggressive debt metrics. However, post-retirement of NCDs, debt levels have significantly reduced, resulting in improved debt protection metrics. ACIL has no long-term debt as of March 31, 2023, with an interest coverage ratio of 7 times for FY2023, highlighting a strengthened financial position.
Valuation
- Archean Chemical Industries Limited has shown revenue growth of 33.32% CAGR for FY2020-2023.
- The Company has shown Net profit growth of 139% of CAGR for FY2021-2023
- The Company’s ROCE is 41%, and ROE is 45%.
- To project income for the fiscal years 2024–2028, we used data from the previous four years (2020–2023).
Estimated Income Statement (₹ in lakhs)
| Mar-24 | Mar-25 | Mar-26 | Mar-27 | Mar-28 | |
| 2024-E | 2025-E | 2026-E | 2027-E | 2028-E | |
| Revenue | 1,56,071.76 | 1,64,113.34 | 1,72,580.80 | 1,81,497.81 | 1,90,889.47 |
| Operating Expenses | 2,455.53 | 2,578.31 | 2,707.23 | 2,842.59 | 2,984.72 |
| Employee Expenses | 7,564.94 | 7,943.18 | 8,340.34 | 8,757.36 | 9,195.23 |
| Other Expenses | 77,672.20 | 81,555.80 | 85,633.60 | 89,915.27 | 94,411.04 |
| EBITDA | 68,379.10 | 72,036.04 | 75,899.64 | 79,982.59 | 84,298.49 |
| Depreciation | 7,010.85 | 7,245.30 | 7,498.74 | 7,771.69 | 8,064.69 |
| EBIT | 61,368.24 | 64,790.75 | 68,400.89 | 72,210.90 | 76,233.80 |
| Financial Cost | 9,776.31 | 10,321.53 | 10,896.65 | 11,503.60 | 12,144.48 |
| EBT before Share of Profit/(Loss) of Joint Venture and Associates | 51,591.93 | 54,469.22 | 57,504.25 | 60,707.29 | 64,089.32 |
| Share of Profit/(Loss) of Joint Venture and Associates | – | – | – | – | – |
| PBT | 51,591.93 | 54,469.22 | 57,504.25 | 60,707.29 | 64,089.32 |
| Tax expenses | 13,018.76 | 13,744.81 | 14,510.67 | 15,318.94 | 16,172.36 |
| PAT | 38,573.18 | 40,724.40 | 42,993.57 | 45,388.36 | 47,916.96 |
DISCLAIMER
This report is only for the information of our customers. Recommendations, opinions, or suggestions are given with the understanding that readers acting on this information assume all risks involved. The information provided herein is not to be construed as an offer to buy or sell securities of any kind. ATS and/or its group companies do not as assume any responsibility or liability resulting from the use of such information.