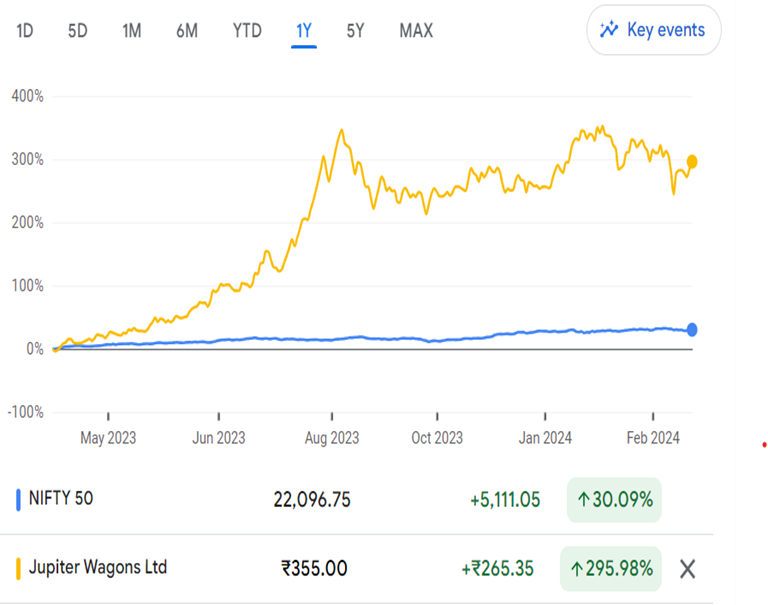
Jupiter Wagons Limited Equity Research ReportMarket Price: ₹355 Recommendation:BUY Target: ₹638 Time Horizon: 1.5 Year
Q3FY2024 REVIEW
Jupiter Wagons Limited reported net revenue of ₹895.84 crores for the quarter ended December 31, 2023, compared to ₹644.43 crores for December 31, 2022. Profit After Tax was ₹81.46 crores for the quarter ended December 31, 2023, against the profit of ₹44.59 crores during the corresponding quarter of the previous year, respectively.
Overview
Jupiter Wagons Limited (JWL), a prominent provider of extensive mobility solutions covering rail, road, and marine transportation, announces the Bonatrans India Private Limited (BIPL) acquisition for Rs. 271 Crore. This strategic acquisition represents a significant achievement for JWL, establishing it as the inaugural rolling stock manufacturing company with its wheel plant.
STOCK DATA
52 Week H/L
434/85
Market Cap (crores)
14,648
Face Value (₹)
10.00
Book Value
20.74
EPS TTM
3.12
NSE Code
JWL
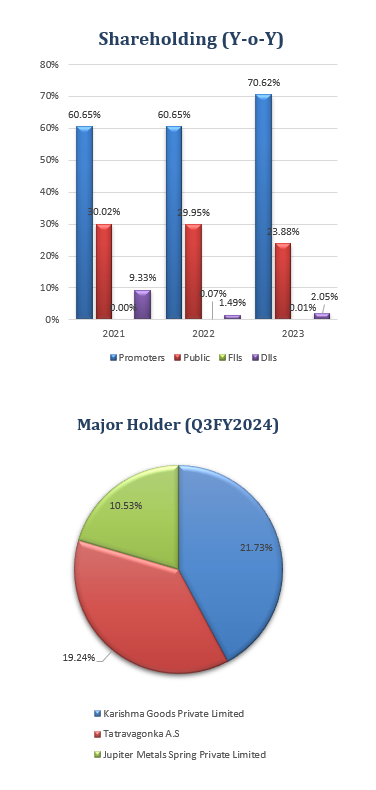
SHAREHOLDING PATTERN (%)
Jun-23
Sep-23
Dec-23
Promoter
72.37
72.37
70.12
Public
25.10
25.77
26.55
DIIs
2.26
1.01
2.05
FIIs
0.27
0.86
1.26
BENCHMARK COMPARISON
Beta: 1.35
Alpha: 265.89
Risk Reward Ratio: 2.99
Margin of Safety: 44 %
Jupiter Wagons Limited (JWL) Business
Jupiter Wagons Limited (JWL) is a leading provider of comprehensive mobility solutions, offering a wide range of products across various sectors, including Freight Wagons, Locomotives, Passenger Coaches (LHB), Braking Systems, Metro Coach, Commercial Vehicles, ISO Marine Containers, and components such as Couplers, Draft Gears, Bogies, and CMS Crossings.
Initially incorporated as Commercial Engineers and Body Builders Co Limited (CEBBCO) in 1979, the company underwent significant transformation under its present management.In 2019, the management, previously associated with JWL, made strategic investments in CEBBCO as part of a debt resolution plan. This led to the amalgamation of JWL with CEBBCO via a reverse merger, resulting in the combined entity being listed on the National Stock Exchange (NSE) and Bombay Stock Exchange (BSE).Subsequently, on May 25, 2022, the company officially changed its name from CEBBCO to Jupiter Wagons Limited (JWL).The leadership team comprises Mr. Murari Lal Lohia, Chairman Emeritus, Mr. Vivek Lohia, current Managing Director, and Mr. Vikash Lohia, Whole Time Director.JWL operates manufacturing facilities in Kolkata, Jamshedpur, Indore, and Jabalpur, which are completely backward integrated with its foundry operations. The organization has laid out essential associations with prestigious global entities such as Tatravagonka (Slovakia), DAKO-CZ (Czech Republic), Kovis Proizvodna (Slovenia), and Telleres Alegria S.A (Spain).With a proud heritage spanning over four decades, JWL has capitalized on its extensive technological expertise and strong financial standing to become a preferred destination for mobility solutions.It has emerged as a comprehensive provider within the industry, catering to diverse sectors, including Railways (Freight + Passenger), Metro Rail, Automobile, Transportation, Logistics, Construction Equipment, Municipalities, Healthcare, Energy, Mining, and Infrastructure.
JWL boasts a prestigious client roster featuring prominent names such as the Indian Railways, American Railroads, Indian Ministry of Defense, Tata Motors, GE, Volvo Eicher Motors, Bharat Benz, and Avia Motors.
Jupiter Wagons LimitedSWOT ANALYSIS
STRENGTH
Strong Technical Capabilities.
Manufacturing Facilities.Strategic Partnerships.
Diverse Product Portfolio.
WEAKNESS
Dependency on External Collaborations.
Integration Challenges.
OPPORTUNITIES
High-Speed Braking Systems Development.
Market Expansion in New Markets.
THREAT
Competitive Landscape.
Economic Uncertainty.
CONSTRUCTION EQUIPMENT INDUSTRY ANALYSIS
With a positive economic outlook and the government’s emphasis on infrastructure development through initiatives like Make in India, the sector is anticipated to sustain growth in the upcoming years.
In the Union Budget 2023-24, the government allocated a record-breaking H 2.40 lakh crore to railway capital expenditures, marking a significant increase of 51% compared to the previous year. Additionally, the allocation to rolling stock more than doubled year-on-year to H 37,581 crore in the same budget.
Indian Railways has achieved its best-ever performance in freight business during the financial year 2022-23, recording an originating freight loading of 1512 MT, representing a growth of about 7% compared to the previous year.
Furthermore, the freight transport unit, NTKM (Net Tonne Kilometre), has also witnessed impressive growth. For the first time, it exceeded the 900 Bn mark, reaching 903 Bn NTKMs in FY 2022-23, reflecting a growth rate of 10%.
Indian Railways has seen significant growth in freight transportation in FY2022-23, particularly in coal, with an incremental loading of 74.6 MT, followed by other goods such as cement, fertilizers, containers, and POL. The increased coal supply to powerhouses, in coordination with the Ministry of Power and Coal, has been a critical factor driving freight performance, resulting in a 17.3% growth in coal transportation compared to the previous year. Additionally, there has been a remarkable increase in automobile loading, with a 65% growth in rakes loaded.
The company, well-equipped with established lines for application wagons, is poised to meet the growing demand. Indian Railways has placed its highest-ever order for approximately 72,000 wagons, with plans for an additional 40,000 wagons. The company aims to increase railways’ share in freight transportation from 27% to 45% by 2030. The commencement of operations of the dedicated freight corridor (DFC) has further bolstered progress, with significant milestones achieved and a substantial portion of the corridor commissioned.
DFC, a vital initiative under the National Logistics Policy, aims to reduce logistics costs from approximately 15% to 8% of the country’s GDP by 2030. With 73.5% of the DFC commissioned, and the alignment expected to be fully operational by December 2023, freight transportation will be seamlessly facilitated from Uttar Pradesh’s hinterlands to the western ports of India.
Jupiter Wagons LimitedFinancial Overview
QUARTERLY SUMMARY
Quarterly (INR in lakhs)
Dec-23
Sep-23
Jun-23
Mar-22
Dec-22
Revenue from Operations
89,584
87,930
75,319
71,170
64,443
Other income
497
579
222
101
192
Total Income
90,081
88,508
75,541
71,271
64,635
Total Expenditure
77,832
76,574
66,293
62,567
57,043
EBIT
12,249
11,935
9,248
8,704
7,592
Finance cost
1,146
1,042
837
872
743
PBT before Share of Net Profit of Associate
11,103
10,893
8,411
7,832
6,848
Share of Net Profit of Associate
-150
58
-21
-76
-123
PBT before Exceptional Item
10,953
10,951
8,390
7,756
6,725
Exceptional Item
–
–
–
–
–
PBT
10,953
10,951
8,390
7,756
6,725
Tax Expenses
2,808
2,744
2,015
3,835
2,266
PAT
8,146
8,208
6,375
3,921
4,460
PROFIT AND LOSS STATEMENT (₹ in lakhs)
Mar-21
Mar-22
Mar-23
Revenue from Operations
99,575.02
1,17,835.40
2,06,824.74
Other Income
183.22
339.14
508.71
Total Income
99,758.24
1,18,174.54
2,07,333.45
Cost of Goods Sold
74,161.32
89,684.40
1,57,447.04
Employee Benefits Expense
2,620.43
3,382.97
4,195.42
Other Expenses
12,160.06
13,357.37
19,976.01
EBITDA
10,816.43
11,749.80
25,714.98
Depreciation and Amortisation Expense
2,117.40
2,337.67
2,497.50
EBIT
8,699.03
9,412.13
23,217.48
Finance Costs
2,111.94
1,816.69
2,888.68
EBT before Share of Profit/(Loss) of Joint Venture and Associates
6,587.09
7,595.44
20,328.80
Share of Profit/(Loss) of Joint Venture and Associates
-7.19
-31.02
-279.77
EBT before Exceptional Items
6,579.90
7,564.42
20,049.03
Exceptional Items
–
–
–
EBT
6,579.90
7,564.42
20,049.03
Tax Expense
1,239.47
2,598.93
7,981.52
PAT Non-Controlling Interests
5,340.43
4,965.49
12,067.51
Non-Controlling Interests
-0.44
2.09
11.22
PAT
5,339.99
4,967.58
12,078.73
EPS
Basic
1.49
1.28
3.12
Diluted
1.49
1.28
3.12
Number of Shares
Basic
3,576.42
3,874.47
3,874.47
Diluted
3,576.42
3,874.47
3,874.47
Balance Sheet (₹ lakhs)
Mar-21
Mar-22
Mar-23
ASSETS:
Non-Current Assets:
Property, Plant and Equipment
38,419.44
39,509.89
43,350.77
Right-of-Use Assets
117.35
109.62
100.76
Capital Work in Progress
2,053.28
2,219.79
2,718.52
Goodwill
2,041.60
2,041.60
2,041.60
Other Intangible Assets
1,238.90
1,102.77
953.09
Intangible Assets Under Development
18.75
–
29.40
Financial Assets:
Investments
203.42
801.85
1,131.77
Bank Balances
283.85
–
–
Loans
40.73
46.32
52.54
Other Financial Assets
243.01
1,039.91
3,395.68
Deferred Tax Assets
5,309.48
2,709.72
–
Non-Current Assets
138.41
211.36
214.33
Other Non-Current Assets
381.35
590.00
1,090.80
Total Non-Current Assets
50,489.57
50,382.83
55,079.26
Current Assets:
Inventories
24,429.53
31,942.99
49,122.91
Financial Assets:
Trade Receivables
7,212.19
7,098.61
21,327.06
Cash and Cash Equivalents
4,704.67
4,069.91
11,713.31
Other Bank Balances
2,431.28
2,819.69
5,025.66
Loans
61.43
55.84
358.26
Other Financial Assets
1,952.31
2,435.67
4,183.27
Current Tax Assets
71.63
38.38
33.73
Other Current Assets
7,692.63
8,396.72
16,559.92
Total Current Assets
48,555.67
56,857.81
1,08,324.12
Assets Held for sale
70.00
–
–
Total Assets
99,115.24
1,07,240.64
1,63,403.38
EQUITY AND LIABILITIES:
Equity:
Equity Share Capital
38,744.74
38,744.74
38,744.74
Other Equity
24,555.41
29,524.56
41,593.62
Equity Attributable to the Owners
63,300.15
68,269.30
80,338.36
Non-Controlling Interest
19.35
17.76
6.44
Total Equity
63,319.50
68,287.06
80,344.80
Liabilities:
Non-Current Liabilities:
Financial Liabilities
Borrowings
3,266.90
2,749.61
1,879.32
Lease Liabilities
42.35
41.84
40.03
Provisions
296.55
300.79
444.35
Deferred Tax Liabilities
–
–
3,002.90
Total Non-Current Liabilities
3,605.80
3,092.24
5,366.60
Current Liabilities:
Financial Liabilities:
Borrowings
10,458.79
11,133.13
26,888.16
Lease Liabilities
0.44
0.51
0.56
Trade Payables:
Total outstanding dues of micro-enterprises and small enterprises
490.84
563.28
863.77
Other Creditors
13,659.62
13,805.30
18,946.01
Other Financial Liabilities
332.28
399.29
531.46
Other Current Liabilities
6,391.02
9,122.26
28,300.89
Provisions
211.19
313.80
192.13
Current Tax Liabilities
645.76
523.77
1,969.00
Total Current Liabilities
32,189.94
35,861.34
77,691.98
Total Equity & Liabilities
99,115.24
1,07,240.64
1,63,403.38
Cash Flow Statement (₹ lakhs)
Mar-21
Mar-22
Mar-23
Net Profit Before Tax
6,586.49
7,595.44
20,328.80
Net Cash from Operating Activities
6,737.57
5,951.92
7,765.09
Net Cash Used for Investing Activities
-6,019.72
-4,910.75
-12,243.90
Net Cash From (Used For) Financing Activities
2,239.11
-1,675.93
12,122.21
Net Increase in Cash and Cash Equivalents
2,956.96
-634.76
7,643.40
Cash And Cash Equivalents at The Beginning of The Year
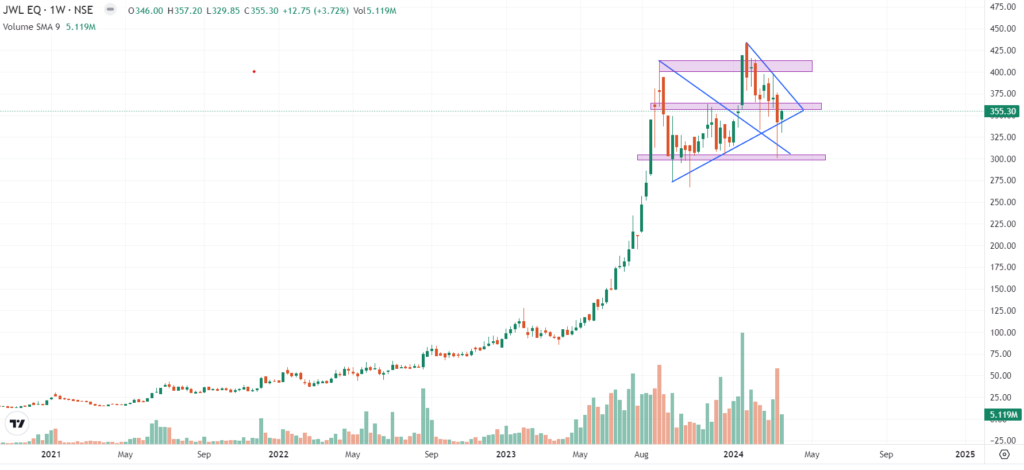
Jupiter Wagons Limited (JWL) recently underwent a notable correction of around 30% before rebounding, finding support near the horizontal trend line at ₹345.
Currently, the stock is consolidating within a range of ₹300 to ₹415, with support and resistance levels identified at ₹300 and ₹415, respectively.
Key Points:
Correction and Rebound:JWL witnessed a notable correction followed by a rebound, signifying a shift in market sentiment. The rebound from the support level near ₹345 suggests underlying buying interest.
Consolidation Phase: The stock is currently consolidating within a range-bound pattern, oscillating between the support level at ₹300 and the resistance level at ₹415. This consolidation phase indicates a period of market indecision.
Support and Resistance Levels: The horizontal trend line near ₹345 has acted as a crucial support level, validating buying pressure. On the other hand, the resistance level at ₹415 has capped upside movements, defining the upper boundary of the consolidation range.
Volume Analysis: Monitoring trading volume during the consolidation phase is essential to gauge the strength of the prevailing trend. A decrease in volume during consolidation may suggest a need for more conviction among market participants.
Con-Call (Q3FY2024)
The company demonstrated strong performance in the third quarter of fiscal year 2024, marked by significant growth in revenue, EBITDA, and profit after Tax.
Total income surged by 39.4% compared to the previous year’s third quarter.
The EBITDA margin notably improved, rising by 140 basis points to 13.9%.
Profit after Tax soared by 79.8% year-on-year in Q3 FY24.
A successful Qualified Institutional Placement raised ₹403 crores.
Expansion initiatives included enlarging the Kolkata foundry and establishing a new greenfield foundry in Jabalpur, which aimed to double the overall foundry capacity to 5,000 metric tons.
The new Jabalpur foundry is expected to yield cost savings, particularly in freight expenses.
The fourth quarter of FY24 is anticipated to witness the commercial launch of E-LCVs.
The company is diversifying into the mobility sector, focusing on commercial vehicles and specialized containers in addition to its core wagon manufacturing.
Revenue targets are set for the brake disc and braking system business.
Notable order wins were secured from Indian Railways, the Defence Ministry, and a prominent Automotive Major.
The demand for wagons, passenger, and metro coaches is expected to sustain growth momentum.
Non-wagon business revenue is projected to exceed 50% of total revenues within 1-2 years.
Government initiatives to establish major rail corridors and convert conventional rail bogies into Vande Bharat are expected to benefit the company.
The company holds a bullish outlook for its brake business, foreseeing substantial growth in the forthcoming years.
Recommendation Rationale
Possessing a robust order book, ensuring clear revenue visibility:
In fiscal 2023, revenue surged by 76% year-on-year, driven by a substantial influx of orders from the wagon segment. Consequently, revenue surpassed Rs 2528 crore in the first nine months of fiscal 2024, marking an 86% increase compared to the same period in fiscal 2023. Despite consistent quarterly revenue bookings, the backlog remained substantial, ranging from Rs 5,953 crore to Rs 7,076 crore over the three quarters ending December 31, 2023.
Additionally, JWL’s backlog as of December 31, 2023, for execution during fiscals 2025-26 from Indian Railways and private counterparts ensures revenue visibility over the medium term. It yields an order book to operating income ratio exceeding two times. Looking ahead, the successful procurement of tender bids and a steady inflow of orders are imperative for maintaining operational scale and optimizing capacity utilization amid capacity expansion initiatives.
The company has solidified its market position through established technology tie-ups and strategic partnerships;
JWL stands as one of India’s leading wagon manufacturers, boasting a current capacity of 9,600 wagons per annum, with plans underway to elevate this capacity to 12,000 by the first quarter of fiscal 2025. With a wealth of experience accumulated over the years, JWL has cultivated strong relationships with government and private clientele across various sectors, including iron & steel, power, logistics, mining, and cement, as well as with other renowned OEMs. These relationships have facilitated a consistent influx of orders.Moreover, JWL has bolstered its technical expertise and capabilities through technology tie-ups and partnerships with global entities. This strategic move has enabled JWL to broaden its product portfolio and diversify beyond its core wagon manufacturing business.
In fiscal year 2023, approximately 80% of JWL’s revenue came from the wagon segment, around 15% from commercial vehicle (CV) load bodies, and the remaining 5% from selling containers and other track items. Additionally, JWL expanded its ventures into brake disc and brake systems for rolling stock and weldable CMS Crossing manufacturing during fiscal years 2023-24.
Valuation
Jupiter Wagons Limited has shown revenue growth of 44.12% CAGR for FY2021-2023.
The company has shown Net profit growth of 50.40% of CAGR for FY2021-2023
The company’s ROCE is 30%, and ROE is 16%.
To project income for the fiscal years 2024–2028, we used data from the previous four years (2020–2023).
Estimated Income Statement (₹ in lakhs)
Mar-24
Mar-25
Mar-26
Mar-27
Mar-28
2024-E
2025-E
2026-E
2027-E
2028-E
Revenue
3,04,445.47
4,47,112.57
6,56,711.51
9,64,650.76
14,17,078.37
Operating Expenses
2,29,650.17
3,37,423.10
4,95,772.98
7,28,435.16
10,70,283.79
Employee Expenses
6,164.30
9,057.15
13,307.60
19,552.74
28,728.68
Other Expenses
31,898.96
46,868.89
68,864.07
1,01,181.41
1,48,665.01
EBITDA
36,732.04
53,763.44
78,766.86
1,15,481.45
1,69,400.90
Depreciation
2,758.00
3,237.65
3,988.37
5,134.80
6,860.18
EBIT
33,974.05
50,525.79
74,778.49
1,10,346.65
1,62,540.72
Financial Cost
4,226.99
6,286.33
9,303.81
13,729.15
20,223.04
EBT before Share of Profit/(Loss) of Joint Venture and Associates
29,747.05
44,239.46
65,474.67
96,617.51
1,42,317.68
Share of Profit/(Loss) of Joint Venture and Associates
-409.39
-608.83
-901.08
-1,329.67
-1,958.61
PBT
29,337.67
43,630.62
64,573.59
95,287.83
1,40,359.07
Tax expenses
11,679.33
17,369.35
25,706.75
37,934.09
55,876.95
PAT
18,067.73
26,870.10
39,767.92
58,683.41
86,440.73
DISCLAIMER
This report is only for the information of our customers. Recommendations, opinions, or suggestions are given with the understanding that readers acting on this information assume all risks involved. The information provided herein is not to be construed as an offer to buy or sell securities of any kind. ATS and/or its group companies do not as assume any responsibility or liability resulting from the use of such information.