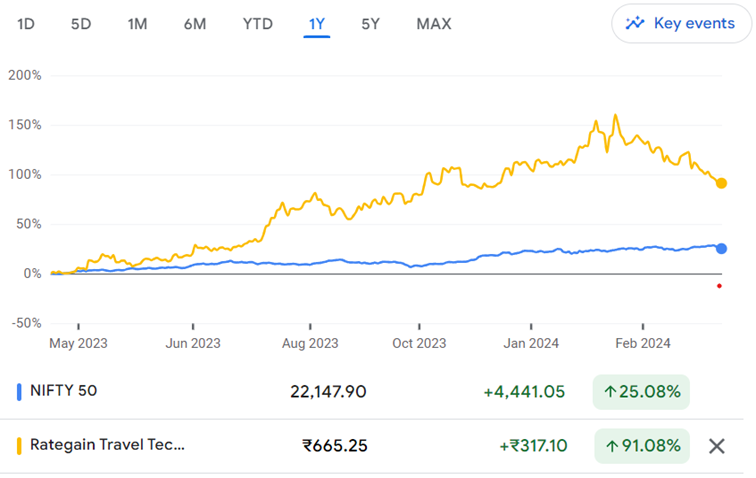
RateGain Travel Technologies Limited Market Price: ₹665 Recommendation: BUY Target: ₹885 Time Horizon: 1 Year
Q3FY2024 REVIEW
RateGain Travel Technologies Limited reported net revenue of ₹252.01 crores for the quarter ended December 31, 2023, compared to ₹138.29 crores for December 31, 2022. Profit After Tax was ₹40.42 crores for the quarter ended December 31, 2023, against the profit of ₹13.23 crores during the corresponding quarter of the previous year, respectively.
OVERVIEW
On April 2, 2024, RateGain Travel Technologies Limited, a leading worldwide supplier of SaaS answers for the travel and hospitality industry and a participant in the Oracle Partner Network (OPN), revealed that its connectivity platform is now accessible through the Oracle Cloud Marketplace. This platform can be implemented on Oracle Cloud Infrastructure (OCI) and seamlessly linked with the Oracle OPERA Cloud through the Oracle Hospitality Integration Platform (OHIP). The Oracle Cloud Marketplace is a centralized hub for enterprise applications provided by Oracle and its network of partners.
STOCK DATA
52 Week H/L
314/921
Market Cap (crores)
7,839
Face Value (₹)
1.00
Book Value
65.52
EPS TTM
6.29
NSE Code
RATEGAIN
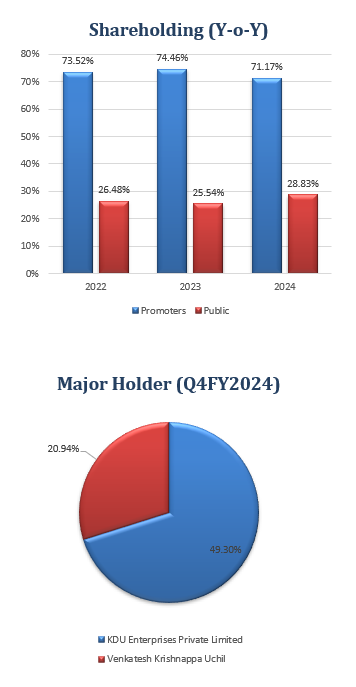
SHAREHOLDING PATTERN (%)
Jun-23
Sep-23
Dec-23
Promoter
55.76
55.72
51.27
Public
21.13
21.06
21.27
DIIs
17.78
17.81
18.77
FIIs
5.33
5.42
8.67
BENCHMARK COMPARISON
Beta: 0.95
Alpha: 265.89
Risk Reward Ratio: 1.53
Margin of Safety: 25 %
BUSINESS
RateGain, established in 2004 and based in Noida, Uttar Pradesh, stands as one of the global leaders in processing electronic transactions and price points within the travel and hospitality sectors. It is a globally recognized provider of AI-driven SaaS solutions for travel and hospitality.
With a vast clientele exceeding 3,200 customers and over 700 partners spanning more than 100 countries, RateGain facilitates accelerated revenue generation by focusing on customer acquisition, retention, and expanding wallet share.
As one of the foremost processors of electronic transactions, price data, and travel intent information globally, RateGain empowers revenue management, distribution, and marketing teams across various segments, including hotels, airlines, meta-search firms, package providers, car rentals, travel management entities, cruises, and ferries.
RateGain boasts collaborations with 26 of the Top 30 Hotel Chains, 25 of the Top 30 Online Travel Agents, 4 of the Top 5 Airlines, and all leading car rental companies. Its client portfolio also encompasses 16 Global Fortune 500 companies, aiding them in unlocking new revenue streams daily.
The company has crafted a comprehensive array of products tailored for the technology ecosystem of the hospitality and travel sectors, explicitly targeting enterprise and mid-market clients.
The organization’s items and administrations can be categorized into three primary areas.
Data as a Service (DaaS): RateGain specializes in capturing and processing forward-looking price data, aiding hotels and travel providers in maintaining competitiveness and optimizing revenue. Leveraging proprietary technology and API partnerships with key players such as online travel agencies (OTAs), hotel chains, car rental companies, vacation rentals, and cruise lines, RateGain ensures access to vital insights to drive strategic decisions.
Distribution: Hotels’ commercial teams often need help establishing direct connections with individual channels or demand partners due to the time-consuming and costly process requiring specialized technical tools.
Martech: RateGain’s Martech solutions aim to drive profitable growth for hotel partners by enabling them to innovate their digital marketing strategies. This facilitates the capture of visitors from their preferred channels, enhancing their online presence and revenue potential.
STRENGTH
Comprehensive Product Portfolio.
Global Reach.
Data Access and Integration.
Strategic Partnerships.
WEAKNESS
Dependency on Technology.
Market Competition.
OPPORTUNITIES
Technological Advancements
Expansion in Emerging Markets.
Diversification of Offerings.
THREAT
Disruption from New Technologies.
Economic Volatility.
TRAVEL AND TOURISM INDUSTRY ANALYSIS
According to the India Brand Equity Foundation, India’s movement and travel industry is ready for significant growth, with projected revenues nearing $24 billion in 2024.
With an anticipated annual growth rate of 9.6% between 2024 and 2028, the industry is expected to expand further, reaching a market volume of $34.25 billion by 2028. This growth is supported by various initiatives to boost tourism, including 100% foreign direct investment in tourism-related ventures to stimulate sectoral growth.
India’s pivotal focus is preserving its rich heritage sites while investing in quality tourism infrastructure. Enhancing visitor experiences includes improving road, rail, and air transportation infrastructure.
Development projects such as new highways, indigenous superfast trains, and establishing regional airports are underway nationwide. These initiatives aim to make travel more convenient and inland destinations more accessible, thereby promoting tourism across diverse regions of the country.
The global demand for travel technologies is propelled by massive movement in travel industry development and increasing automation across various sectors. Factors such as the adoption of software-as-a-service (SaaS)- based models and artificial intelligence (AI) are further driving the expansion of the market.
According to Fact.MR, the global market for travel technologies, is projected to reach a value of US$12.9 billion by 2033, experiencing a Compound Annual Growth Rate (CAGR) of 7.9% over the next decade. This growth reflects the need for advanced technological solutions in the travel industry to meet evolving consumer demands, streamline operations, and enhance efficiency.
The increasing integration of AI and automation in travel technologies is expected to revolutionize various aspects of the industry, including customer service, personalized marketing, revenue management, and operational optimization. SaaS-based models offer scalability, flexibility, and cost-effectiveness, making them increasingly attractive to businesses seeking innovative solutions.
Overall, the projected growth of the global travel technologies market underscores the importance of leveraging advanced technological solutions to stay competitive and meet the evolving needs of the travel and tourism industry in the coming years.
FINANCIAL OVERVIEW
QUARTERLY SUMMARY
Quarterly (INR in millions)
Dec-23
Sep-23
Jun-23
Mar-22
Dec-22
Revenue from Operations
2,520
2,347
2,145
1,829
1,383
Other income
109
37
60
48
6
Total Income
2,629
2,384
2,205
1,877
1,388
Total Expenditure
2,105
1,987
1,880
1,615
1,238
EBIT
524
396
325
262
151
Finance cost
4
4
3
3
4
PBT before Share of Net Profit of Associate
520
393
321
258
147
Share of Net Profit of Associate
–
–
–
–
–
PBT before Exceptional Item
520
393
321
258
147
Exceptional Item
–
–
–
–
–
PBT
520
393
321
258
147
Tax Expenses
116
92
72
-108
15
PAT
404
300
249
366
132
PROFIT AND LOSS STATEMENT (₹ in millions)
Mar-21
Mar-22
Mar-23
Revenue from Operations
2,507.93
3,665.91
5,651.28
Other Income
132.98
165.22
199.32
Total Income
2,640.91
3,831.13
5,850.60
Employee Benefits Expense
1,512.62
1,913.74
2,527.56
Other Expenses
933.72
1,446.62
2,277.21
EBITDA
194.57
470.77
1,045.83
Depreciation and Amortisation Expense
358.81
300.64
358.14
EBIT
-164.24
170.13
687.69
Finance Costs
82.04
52.33
15.11
EBT before Share of Profit/(Loss) of Joint Venture and Associates
-246.28
117.80
672.58
Share of Profit/(Loss) of Joint Venture and Associates
–
–
–
EBT before Exceptional Items
-246.28
117.80
672.58
Exceptional Items
–
-9.43
–
EBT
-246.28
108.37
672.58
Tax Expense
39.47
24.18
-11.43
PAT Non-Controlling Interests
-285.75
84.19
684.01
Non-Controlling Interests
–
–
–
PAT
-285.75
84.19
684.01
EPS
Basic
-3.09
0.84
6.33
Diluted
-3.09
0.83
6.29
Number of Shares
Basic
92.46
99.70
108.08
Diluted
92.46
100.94
108.78
Balance Sheet (₹ millions)
Mar-21
Mar-22
Mar-23
ASSETS:
Non-Current Assets:
Property, Plant and Equipment
79.02
65.50
63.08
Right-of-Use Assets
45.62
179.21
166.50
Goodwill
368.57
687.56
1,737.28
Other Intangible Assets
1,185.60
1,292.65
1,991.18
Intangible Assets Under Development
–
–
14.26
Financial Assets:
Investments
–
228.86
238.61
Others
7.84
17.86
19.75
Income Tax Assets
7.94
6.06
8.53
Deferred Tax Assets
29.92
42.28
157.49
Other Non-Current Assets
0.53
8.58
9.44
Total Non-Current Assets
1,725.04
2,528.56
4,406.12
Current Assets:
Investments
1,290.23
1,417.79
1,160.13
Trade Receivables
669.05
1,005.58
1,607.83
Cash and Cash Equivalents
537.56
340.98
999.30
Other Bank Balances
35.82
2,110.03
1,015.28
Loans
2.09
4.67
3.93
Others
26.22
258.45
37.78
Other Current Assets
112.03
144.85
222.45
Total Current Assets
2,673.00
5,282.35
5,046.70
Total Assets
4,398.04
7,810.91
9,452.82
EQUITY AND LIABILITIES:
Equity:
Equity Share Capital
6.55
107.31
108.32
Instrument Entirely Equity in Nature
1.48
–
–
Other Equity
2,441.18
6,084.22
6,989.12
Equity Attributable to the Owners
2,449.21
6,191.53
7,097.44
Non-Controlling Interest
Total Equity
2,449.21
6,191.53
7,097.44
Liabilities:
Non-Current Liabilities:
Financial Liabilities
Borrowings
980.74
–
–
Lease Liabilities
26.22
147.24
140.33
Others
–
51.90
152.78
Provisions
32.93
37.59
44.48
Deferred Tax Liabilities
–
86.56
93.57
Other Non-Current Liabilities
–
0.15
1.21
Total Non-Current Liabilities
1,039.89
323.44
432.37
Current Liabilities:
Financial Liabilities:
Borrowings
137.19
–
–
Lease Liabilities
27.09
33.14
36.58
Trade Payables:
Total outstanding dues of micro-enterprises and small enterprises
0.14
2.69
7.00
Other Creditors
242.82
415.44
815.65
Others
105.33
255.77
333.91
Other Current Liabilities
369.83
520.16
677.24
Provisions
2.13
2.54
3.11
Income Tax Liabilities
24.41
66.20
49.52
Total Current Liabilities
908.94
1,295.94
1,923.01
Total Equity & Liabilities
4,398.04
7,810.91
9,452.82
Cash Flow Statement (₹ millions)
Mar-21
Mar-22
Mar-23
Net Profit Before Tax
-246.28
108.37
672.58
Net Cash from Operating Activities
205.95
168.05
519.18
Net Cash Used for Investing Activities
-817.18
-2,951.41
125.81
Net Cash From (Used For) Financing Activities
928.83
2,399.07
-17.01
Net Increase in Cash and Cash Equivalents
317.60
-384.29
627.98
Cash And Cash Equivalents at The Beginning of The Year
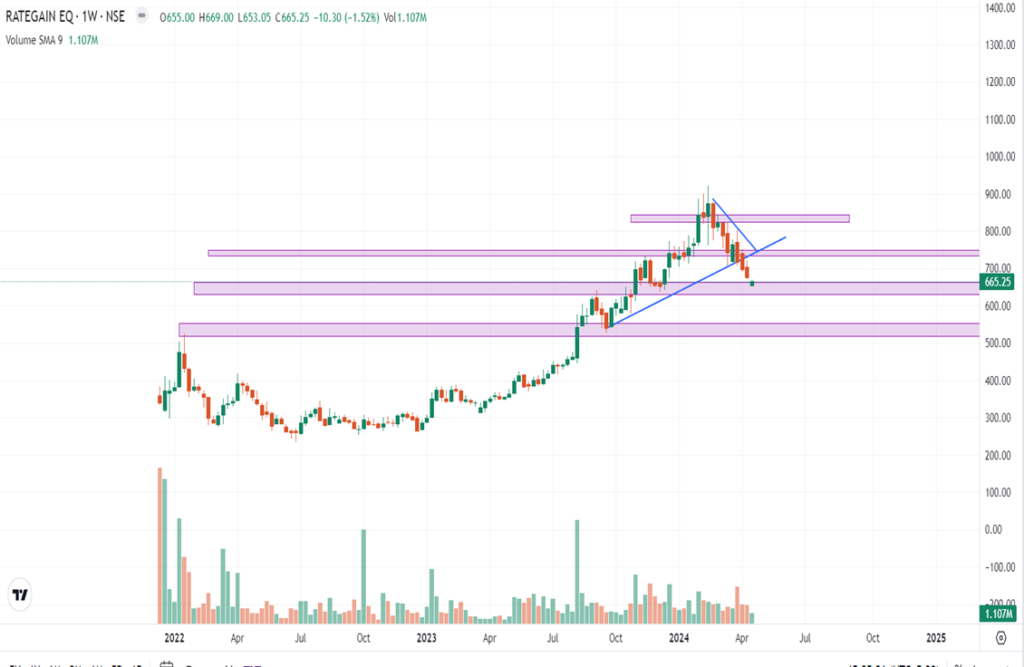
RateGain Travel Technologies Limited recently experienced a significant correction of approximately 29% before undergoing a notable rebound.
The stock found support near the horizontal trend line at ₹665, indicating a potential reversal in the downtrend.
This rebound suggests a shift in market sentiment, with underlying buying interest becoming apparent at the support level.
The stock is in a consolidation phase, characterized by a range-bound pattern between ₹660 and ₹760.
The support and resistance levels are identified at ₹600 and ₹830, respectively. This consolidation indicates a period of indecision in the market, with neither buyers nor sellers dominating the price action.
Con-Call (Q3FY2024)
They exhibited robust performance during the quarter, which was marked by substantial growth, enhanced profitability, and impressive financial results.
Annual recurring revenue surpassed ₹1,008.1 crores, registering an 82% year-over-year increase. Third-quarter revenue also surged by 82% to reach ₹252 crores.
Margins stood at 20.3%, indicating profitable scaling and achieving a 20% EBITDA within two years. New contract wins amounted to ₹84.4 crores, marking a 71% growth compared to last year’s quarter.
Cash flow generation notably improved, with cash flow from operations reaching ₹99 crores over nine months. The company’s increased profitability is reflected in its net worth doubling to ₹1,400 crores, with a cash balance of ₹1,020 crores. The Adara acquisition is performing well, garnering significant traction and investments for future growth.
The adoption of generative AI is enhancing customer experience, driving cost efficiencies, and optimizing revenue. The industry outlook is positive, presenting a favourable year for the travel sector, supported by macroeconomic conditions conducive to consumer spending. The distribution segment constitutes 22.2% of total revenue, with anticipated growth following a recent large order win.
The company maintains strong customer relationships with low churn rates and is focused on expanding existing partnerships. A strategic focus on M&A activities includes actively engaging with prospects and considering strategic acquisitions.
Revenue guidance for FY 2024 has been increased to nearly 69% year-over-year growth, with EBITDA margin guidance close to 19.5%. The DaaS segment is experiencing strong growth momentum driven by volume growth and demand for AI models.
The Asia-Pacific region exhibits robust recovery, leading to increased leadership and sales efforts. The company is committed to building future leaders, nurturing talent, and fostering a diverse, inclusive, and equitable culture for sustained success.
Recommendation Rationale
Strong Client base:
RateGain Travel Technologies Limited is a leading global provider of AI-powered Software as a Service (SaaS) solutions tailored to the travel and hospitality industries. Collaborating with over 3,200 customers and 700 partners across more than 100 countries, RateGain facilitates accelerated revenue generation through strategies focusing on customer acquisition, retention, and expanding wallet share.
Notably, RateGain boasts partnerships with 26 of the Top 30 Hotel Chains, 25 of the Top 30 Online Travel Agents, 4 of the Top 5 Airlines, and all major car rental companies. These partnerships underscore RateGain’s significant presence and influence in the travel and hospitality sector, positioning it as a trusted ally in optimizing business outcomes for a diverse clientele.
RateGain Travel Technologies Limited counts several renowned names in the hospitality industry among its marquee customers, including Six Continents Hotels, InterContinental Hotels Group, Kessler Collection, Lemon Tree Hotels, Oyo Hotels, and Homes Pvt Ltd. These esteemed clients reflect RateGain’s ability to deliver high-quality AI-powered SaaS solutions tailored to the unique needs of leading players in the hotel and accommodation sector.
Improving Financial Metrics;
RateGain Travel Technologies Limited has made significant strides in improving its financial performance and strengthening its balance sheet:
EBIT Margins Improvement: The company’s EBIT margins have remarkably improved, increasing from -6.55% in FY2021 to 12.17% in FY2023. This enhancement reflects the company’s successful efforts in optimizing its operational efficiency and profitability.
Successful IPO and Debt Reduction: During FY22, RateGain Travel Technologies Limited raised Rs. 1335 Crores through its initial public offering (IPO). The company strategically utilized the proceeds from the IPO to achieve various objectives, including debt reduction. As a result, the company is now net debt-free, indicating a healthier financial position and reduced financial risk.
Strong Interest Coverage Ratio: The interest coverage ratio for FY2023 stands at an impressive 45x. This ratio signifies the company’s ability to meet its interest obligations with its operating income comfortably. A high interest coverage ratio reflects financial stability and indicates a lower risk of default on debt obligations.
Valuation
RateGain Travel Technologies Limited has shown revenue growth of 50.11% CAGR for FY2021-2023.
The company’s net profit has improved from -₹28.57 crores to ₹68.40 crores from FY2021-2023.
The company’s ROCE is 10%, and ROE is 10%.
To project income for the fiscal years 2024–2028, we used data from the previous four years (2021–2023).
Estimated Income Statement (₹ in millions)
Mar-24
Mar-25
Mar-26
Mar-27
Mar-28
2024-E
2025-E
2026-E
2027-E
2028-E
Revenue
8,705.51
12,984.58
19,401.45
29,027.66
43,472.23
Employee Expenses
3,564.23
5,352.23
8,037.18
12,069.05
18,123.51
Other Expenses
3,224.78
4,842.49
7,271.74
10,919.62
16,397.46
EBITDA
1,916.50
2,789.86
4,092.53
6,038.99
8,951.25
Depreciation
541.64
422.65
345.35
304.34
298.35
EBIT
1,374.86
2,367.21
3,747.18
5,734.66
8,652.91
Financial Cost
30.21
52.01
82.33
126.00
190.12
EBT before Share of Profit/(Loss) of Joint Venture and Associates
1,344.65
2,315.19
3,664.84
5,608.65
8,462.78
Share of Profit/(Loss) of Joint Venture and Associates
This report is only for the information of our customers. Recommendations, opinions, or suggestions are given with the understanding that readers acting on this information assume all risks involved. The information provided herein is not to be construed as an offer to buy or sell securities of any kind. ATS and/or its group companies do not as assume any responsibility or liability resulting from the use of such information.