- Suyog Telematics Limited (SUYOG) Market Price: ₹1145 Recommendation: BUY Target: ₹1711 Time Horizon: 1 Year
Q3FY2024 REVIEW
Suyog Telematics Limited (SUYOG) reported net revenue of ₹41.71 crores for the quarter ended December 31, 2023, compared to ₹37.65 crores for December 31, 2022. Profit After Tax was ₹19.11 crores for the quarter ended December 31, 2023, against the profit of ₹10.11 crores during the corresponding quarter of the previous year, respectively.
OVERVIEW
- During the December 31, 2023 quarter, the company successfully recuperated ₹2.20 crores in bad debts from Vodafone Idea Limited.
STOCK DATA
52 Week H/L | 330/1365 |
Market Cap (crores) | 1,262 |
Face Value (₹) | 10.00 |
Book Value | 222.96 |
EPS TTM | 44.17 |
BSE Code | 537259 |
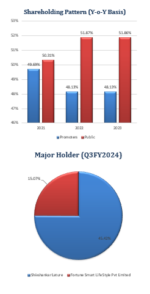
SHAREHOLDING PATTERN (%)
Jun-23 | Sep-23 | Dec-23 | |
Promoter | 48.19 | 47.93 | 47.37 |
Public | 51.81 | 52.07 | 52.63 |
BENCHMARK COMPARISON
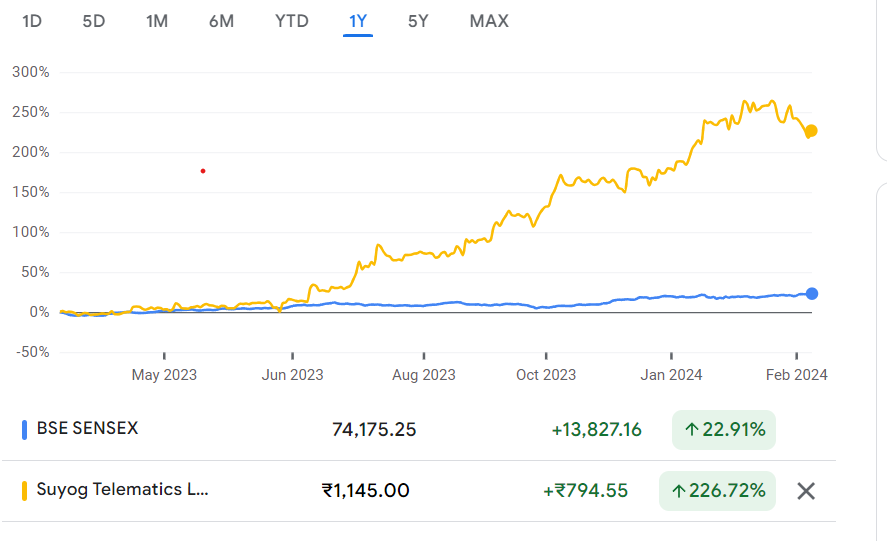
Beta: 0.73 | Alpha: 203.81 | Risk Reward Ratio: 1.99 | Margin of Safety: 33% |
BUSINESS
- Suyog Telematics Limited (SUYOG) is an innovative force in the telecommunications sector. It is dedicated to providing state-of-the-art infrastructure solutions for telecom towers. The company prioritizes enhancing connectivity across urban and rural regions, emphasizing strategic methodologies.
- Suyog Telematics Limited (SUYOG) specializes in high-capacity small-cell infrastructure, fibre optic connectivity, and eco-conscious solutions. Serving a broad clientele, including prominent telecom operators, the company facilitates the transition of cities into 5G-enabled centres and empowers rural communities with advanced network capabilities.
- Followings is the Business Model:
- a) Site Identification: The company specializes in swiftly identifying suitable locations for tower infrastructure deployment and boasts industry-leading turnaround times.
- b) Site Deployment: Upon location identification, the company secures land leases and proceeds to deploy tower infrastructure.
- c) Infrastructure Sharing: Once the tower infrastructure is established, the company leases it out to wireless tenants through long-term Master Service Agreements (MSAs). These agreements guarantee a steady income stream with escalations of 2.5% per annum over an average tenure of 10+ years.
- d) Revenue Model: The company monetizes its infrastructure by leasing co-located sites to multiple operators for seven years. Additionally, the company imposes exit penalties to ensure enduring revenue streams.
- The company provides various telecommunications products, such as cables, panels, generators, earth strips, batteries, power and fibre cables, and galvanized poles, all customized to meet customers’ specific requirements.
- The company maintains a presence in 15 telecom circles spanning 26 states, operating a network of over 4300 towers and facilitating more than 5100 tenancies, encompassing 3811 Small Cell Tenancies and 900 Government Sites Tenancies. Furthermore, it has laid an extensive fibre network spanning over 4891 kilometres.
SWOT ANALYSIS
STRENGTH
- Extensive Network Presence.
- Diverse Tenancy Portfolio.
- Industry Experience.
- Fiber Network Expansion.
WEAKNESS
- Dependence on the Telecom Industry.
- Regulatory
OPPORTUNITIES
- Diverse Telecom Operators.
- Geographical Footprint.
- Diversification of Services.
THREAT
- Technology Disruption.
Competitive Landscape.
TELECOM SECTOR ANALYSIS
v The telecom industry in India, ranking as the second largest globally, boasted a subscriber base of 1.079 billion as of December 2023, encompassing both wireless and wireline subscribers.
v With an overall teledensity of 85.23%, the largely untapped rural market recorded 58.56%, contrasting with the urban market’s 133.76%. By March 2023, internet subscribers reached 881.25 million, with 40.62% hailing from rural areas. Notably, average monthly data consumption per wireless subscriber surged to 17.36 GB in March 2023, a significant increase from 61.66 MB in March 2014.
v The industry’s robust growth stems from affordable tariffs, enhanced coverage, Mobile Number Portability (MNP), evolving subscriber consumption patterns, government initiatives to bolster domestic telecom manufacturing and favourable regulatory policies. To accelerate digital connectivity, the Government greenlit the auction of IMT/5G spectrum, successfully held by July 2022, amassing $18.77 billion.
v The telecommunications industry encompasses several subsectors: Infrastructure, Equipment, Mobile Virtual Network Operators (MNVO), White Space Spectrum, 5G, Telephone service providers, and Broadband.
v According to GSMA, India is poised to emerge as the world’s second-largest smartphone market by 2025, with approximately 1 billion installed devices and an estimated 920 million unique mobile subscribers, including 88 million 5G connections. Additionally, it is projected that 5G technology will contribute around $450 billion to the Indian economy between 2023 and 2040.
v The rollout of 5G technology is being facilitated through the PM GatiShakti National Master Plan platform. Telecom assets, including approximately 2 million telecom towers from all Telecom Service Providers (TSPs), are being meticulously mapped on this platform. Each tower’s details, such as whether it is ‘fiberized’ or ‘non-fiberized’, are recorded. Utilizing a tool developed by BISAG on the PM GatiShakti National Master Plan platform, the required length and route of the nearest Optical Fiber Cable (OFC) to a specific non-fiberized tower are calculated. This enables the fiberization of non-fiberized towers by connecting them to the closest available OFC. Moreover, companies interested in purchasing available OFCs to connect their non-fiberized towers can now do so with greater ease and efficiency.
FINANCIAL OVERVIEW
QUARTERLY SUMMARY
Quarterly (INR in lakhs) | Dec-23 | Sep-23 | Jun-23 | Mar-22 | Dec-22 |
Revenue from Operations | 4,171.86 | 4,084.66 | 3,868.82 | 3,823.55 | 3,765.53 |
Other income | 143.49 | 300.14 | 74.97 | 131.43 | 210.78 |
Total Income | 4,315.35 | 4,384.80 | 3,943.79 | 3,954.98 | 3,976.31 |
|
|
|
|
|
|
Total Expenditure | 1,614.02 | 2,093.14 | 1,894.48 | 2,372.72 | 2,183.26 |
EBIT | 2,701.33 | 2,291.66 | 2,049.31 | 1,582.26 | 1,793.05 |
|
|
|
|
|
|
Finance cost | 544.24 | 556.59 | 434.34 | 533.81 | 221.89 |
PBT before Share of Net Profit of Associate | 2,157.09 | 1,735.07 | 1,614.97 | 1,048.45 | 1,571.16 |
|
|
|
|
|
|
Share of Net Profit of Associate | – | – | – | – | – |
PBT before Exceptional Item | 2,157.09 | 1,735.07 | 1,614.97 | 1,048.45 | 1,571.16 |
|
|
|
|
|
|
Exceptional Item | – | – | – | – | – |
PBT | 2,157.09 | 1,735.07 | 1,614.97 | 1,048.45 | 1,571.16 |
|
|
|
|
|
|
Tax Expenses | 246.24 | 110.20 | 391.11 | -215.63 | 560.08 |
PAT | 1,910.85 | 1,624.87 | 1,223.86 | 1,264.08 | 1,011.08 |
PROFIT AND LOSS STATEMENT (₹ in lakhs)
| Mar-21 | Mar-22 | Mar-23 |
Revenue from Operations | 13,179.75 | 12,633.88 | 14,364.44 |
Other Income | 273.19 | 550.69 | 863.79 |
Total Income | 13,452.94 | 13,184.57 | 15,228.23 |
|
|
|
|
Cost of Goods Sold | 4,009.66 | 1,828.84 | 2,013.04 |
Employee Benefits Expense | 2,074.30 | 1,122.87 | 1,416.01 |
Other Expenses | 536.25 | 1,018.25 | 1,650.80 |
EBITDA | 6,832.73 | 9,214.61 | 10,148.38 |
|
|
|
|
Depreciation and Amortisation Expense | 1,570.88 | 2,157.63 | 2,643.21 |
EBIT | 5,261.85 | 7,056.98 | 7,505.17 |
|
|
|
|
Finance Costs | 1,038.79 | 1,383.99 | 1,605.21 |
EBT before Share of Profit/(Loss) of Joint Venture and Associates | 4,223.06 | 5,672.99 | 5,899.96 |
|
|
|
|
Share of Profit/(Loss) of Joint Venture and Associates | – | – | – |
EBT before Exceptional Items | 4,223.06 | 5,672.99 | 5,899.96 |
|
|
|
|
Exceptional Items | – | – | – |
EBT | 4,223.06 | 5,672.99 | 5,899.96 |
|
|
|
|
Tax Expense | 1,783.06 | 1,534.77 | 1,269.37 |
PAT Non-Controlling Interests | 2,440.00 | 4,138.22 | 4,630.59 |
|
|
|
|
Non-Controlling Interests | – | – | – |
|
|
|
|
PAT | 2,440.00 | 4,138.22 | 4,630.59 |
|
|
|
|
EPS |
|
|
|
Basic | 24.03 | 39.48 | 44.18 |
Diluted | 24.03 | 40.75 | 44.18 |
|
|
|
|
Number of Shares |
|
|
|
Basic | 101.54 | 104.82 | 104.82 |
Diluted | 101.54 | 101.55 | 104.82 |
Balance Sheet (₹ lakhs)
| Mar-21 | Mar-22 | Mar-23 |
ASSETS: |
|
| |
Non-Current Assets: |
|
|
|
Property, Plant and Equipment | 15,712.24 | 20,408.47 | 26,763.84 |
Right of Use Assets | 3,920.12 | 5,191.96 | 6,963.67 |
Capital Work in Progress | 1,908.53 | 1,239.07 | 283.60 |
Other Intangible Assets | 7.91 | 5.93 | 269.38 |
Financial Assets: |
|
|
|
Investments | 1.00 | 39.55 | 75.55 |
Other Financial Assets | 2,008.59 | 2,042.75 | 3,334.38 |
Other Non-Current Assets | 33.58 | – | 15.47 |
Total Non-Current Assets | 23,591.97 | 28,927.73 | 37,705.89 |
|
|
|
|
Current Assets: |
|
|
|
Inventories | 277.23 | 518.04 | 531.71 |
Financial Assets: |
|
|
|
Trade Receivables | 2,682.25 | 2,673.51 | 4,055.39 |
Cash and Cash Equivalents | 293.22 | 322.59 | 217.49 |
Loans | 1,607.66 | 1,458.60 | 2,739.44 |
Other Financial Assets | 270.78 | 135.69 | 134.32 |
Other Current Assets | 2,631.12 | 2,049.67 | 2,448.85 |
Current Tax Assets | – | – | 144.56 |
Total Current Assets | 7,762.26 | 7,158.10 | 10,271.76 |
|
|
|
|
Total Assets | 31,354.23 | 36,085.83 | 47,977.65 |
|
|
|
|
EQUITY AND LIABILITIES: |
|
|
|
Equity: |
|
|
|
Equity Share Capital | 1,015.44 | 1,048.24 | 1,048.24 |
Other Equity | 13,334.68 | 17,782.51 | 22,377.65 |
Equity Attributable to the Owners | 14,350.12 | 18,830.75 | 23,425.89 |
|
|
|
|
Non-Controlling Interest | – | – | – |
Total Equity | 14,350.12 | 18,830.75 | 23,425.89 |
|
|
|
|
Liabilities: |
|
|
|
Non-Current Liabilities: |
|
|
|
Financial Liabilities |
|
|
|
Borrowings | 2,979.01 | 4,554.81 | 7,528.20 |
Lease Liabilities | 3,291.47 | 3,857.30 | 3,312.16 |
Provisions | 68.53 | 72.71 | 93.88 |
Deferred Tax Liabilities | 1,849.73 | 2,471.75 | 3,278.04 |
Total Non-Current Liabilities | 8,188.74 | 10,956.57 | 14,212.28 |
|
|
|
|
Current Liabilities: |
|
|
|
Financial Liabilities: |
|
|
|
Borrowings | 1,053.18 | 1,073.28 | 1,988.91 |
Lease Liabilities | 2,024.02 | 2,275.36 | 2,976.95 |
Trade Payables: |
|
|
|
Total outstanding dues of micro-enterprises and small enterprises |
|
|
|
Other Creditors | 3,283.16 | 1,253.51 | 4,089.99 |
Other Financial Liabilities | 284.03 | 382.20 | 385.39 |
Other Current Liabilities | 993.91 | 452.97 | 91.04 |
Provisions | 490.49 | 337.45 | 807.20 |
Current Tax Liabilities | 686.58 | 523.74 | – |
Total Current Liabilities | 8,815.37 | 6,298.51 | 10,339.48 |
|
|
|
|
Total Equity & Liabilities | 31,354.23 | 36,085.83 | 47,977.65 |
Cash Flow Statement (₹ lakhs)
| Mar-21 | Mar-22 | Mar-23 |
Net Profit Before Tax | 4,223.06 | 5,673.00 | 5,899.96 |
Net Cash from Operating Activities | 5,971.70 | 4,655.46 | 6,703.07 |
Net Cash Used for Investing Activities | -4,483.78 | -7,362.29 | -10,799.07 |
Net Cash From (Used For) Financing Activities | -1,834.74 | 2,736.20 | 3,990.91 |
Net Increase in Cash and Cash Equivalents | -346.82 | 29.37 | -105.09 |
Cash And Cash Equivalents at The Beginning of The Year | 640.08 | 293.26 | 322.63 |
Cash And Cash Equivalents at The End of the Year | 293.26 | 322.63 | 217.30 |
Ratio Analysis
| Mar-21 | Mar-22 | Mar-23 |
Profitability Ratio |
|
| |
EBITDA Margin | 51.84% | 72.94% | 70.65% |
EBIT Margin | 39.92% | 55.86% | 52.25% |
Pre-Tax Margin | 32.04% | 44.90% | 41.07% |
Net Profit Margin | 18.51% | 32.75% | 32.24% |
|
|
| |
Return on Investment |
|
| |
Return on Asset – ROA | 9% | 12% | 11% |
Return on Capital Employed – ROCE | 27% | 27% | 22% |
Return on Equity – ROE | 18% | 25% | 22% |
|
|
| |
Liquidity Ratio (x) |
|
| |
Current ratio | 0.88 | 1.14 | 0.99 |
Quick Ratio | 0.85 | 1.05 | 0.94 |
|
|
| |
Solvency Ratio |
|
| |
Debt to Equity | 0.21 | 0.24 | 0.32 |
Interest Coverage Ratio | 5.07 | 5.10 | 4.68 |
Technical Analysis
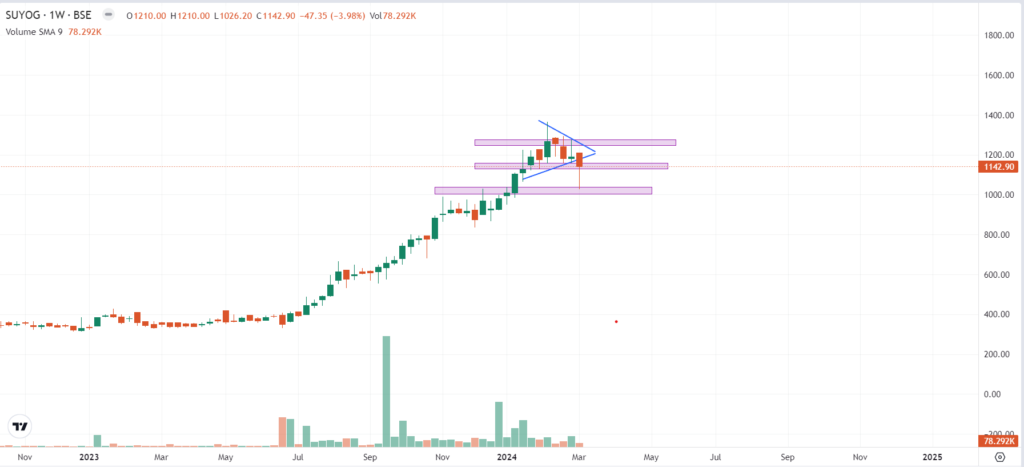
Ø Overview:
o Suyog Telematics Limited is currently exhibiting an upward monthly and weekly trend, indicating positive investor sentiment. However, recent price action suggests a temporary dip followed by a rebound, which could offer insight into potential future movements.
Ø Price Action Analysis:
o The stock recently experienced a break of its supporting trend line, with a low of ₹1026. This breach could signal a potential shift in momentum and raise concerns among investors.
Ø Support and Resistance Levels:
o Support Level: ₹1060
o Resistance Level: ₹1290
Ø Conclusion:
o Suyog Telematics Limited is currently in an upward trend, supported by positive sentiment on both monthly and weekly bases. Despite a recent breach of the supporting trend line, the stock rebounded and closed near its support level of ₹1055. However, caution is advised as the stock approaches its resistance level of ₹1290.
Recommendation Rationale
v Established a strong foothold in the local market:
o Established in 1995 by Mr Shivshankar Lature, STL specializes in constructing, owning, and managing telecommunication infrastructure such as poles, towers (with a focus on rooftop towers), optical fibre cable (OFC) systems, and related assets. These passive infrastructure assets are shared with wireless and other communication service providers. Registered as an Infrastructure Provider Category-I (IP-I) with the Department of Telecommunications (DoT), STL has cultivated strong partnerships with various telcos and operates efficiently.
o Beyond its traditional stronghold in the Mumbai circle, the company has diversified its operational areas and now maintains a presence in 15 telecom circles across 26 states. STL’s network comprises over 4300 towers, facilitating more than 5100 tenancies, including 3811 Small Cell Tenancies and 900 Government Sites Tenancies.
v Expanding Client Portfolio with Emphasis on 5G Network Technology:
o The company’s main clientele consists of Bharti Airtel, Vodafone Idea, and Reliance Jio, with additional business dealings with BSNL and TTSL. BSNL is being repositioned as a robust telecom service provider, particularly addressing connectivity disparities in remote areas of India. The Union cabinet’s approval of a comprehensive revival package totalling ₹89,047 crore for BSNL underscores this commitment, encompassing the allocation of the 4G/5G spectrum through equity infusion. This package also includes budgetary support for various spectrum bands, paving the way for BSNL’s technological advancement and improved service offerings.
o Moreover, the company is concentrating on deploying high-power Small Cell Infrastructure to prepare urban areas for 5G readiness, establishing RLS sites to provide 5G network coverage to rural villages, and introducing FTTH solutions to fulfil every household’s aspirations for faster 5G speeds. Additionally, the fiberization of mobile towers is being prioritized to expedite the rollout of 5G services.
v Financial solid risk profile:
o Despite the planned capital expenditure (capex) of ₹35-50 crore for the current fiscal year, the financial risk profile is anticipated to stay robust. As of March 31, 2023, the net worth stood at ₹235 crores. Additionally, debt protection metrics remain favourable, with interest coverage reaching 4.68 times in the fiscal year 2023.
Valuation
Ø Suyog Telematics Limited has shown revenue growth of 5.50% CAGR for FY2020-2023.
Ø The company has shown Net profit growth of 12% of CAGR for FY2020-2023
Ø The company’s ROCE is 22%, and ROE is 22%.
Ø To project income for the fiscal years 2024–2028, we used data from the previous four years (2020–2023).
Estimated Income Statement (₹ in lakhs)
| Mar-24 | Mar-25 | Mar-26 | Mar-27 | Mar-28 |
| 2024-E | 2025-E | 2026-E | 2027-E | 2028-E |
Revenue | 16,142.89 | 17,113.94 | 18,145.01 | 19,239.96 | 20,402.92 |
Operating Expenses | 1,823.13 | 1,928.25 | 2,039.44 | 2,157.03 | 2,281.41 |
Employee Expenses | 1,497.66 | 1,584.02 | 1,675.35 | 1,771.96 | 1,874.13 |
Other Expenses | 1,485.24 | 1,570.88 | 1,661.46 | 1,757.26 | 1,858.59 |
EBITDA | 11,336.87 | 12,030.80 | 12,768.77 | 13,553.71 | 14,388.79 |
Depreciation | 3,222.21 | 3,468.46 | 3,722.29 | 3,984.86 | 4,257.32 |
EBIT | 8,114.65 | 8,562.34 | 9,046.48 | 9,568.85 | 10,131.47 |
Financial Cost | 1,735.57 | 1,831.32 | 1,934.87 | 2,046.59 | 2,166.92 |
EBT before Share of Profit/(Loss) of Joint Venture and Associates | 6,379.09 | 6,731.02 | 7,111.61 | 7,522.26 | 7,964.54 |
Share of Profit/(Loss) of Joint Venture and Associates | – | – | – | – | – |
PBT | 6,379.09 | 6,731.02 | 7,111.61 | 7,522.26 | 7,964.54 |
Tax expenses | 1,372.45 | 1,448.17 | 1,530.06 | 1,618.41 | 1,713.56 |
PAT | 5,006.63 | 5,282.85 | 5,581.56 | 5,903.85 | 6,250.98 |
DISCLAIMER
This report is only for the information of our customers. Recommendations, opinions, or suggestions are given with the understanding that readers acting on this information assume all risks involved. The information provided herein is not to be construed as an offer to buy or sell securities of any kind. ATS and/or its group companies do not as assume any responsibility or liability resulting from the use of such information.